Is It Cheaper to Leave the Heat On All Day? - 14,256 Homes
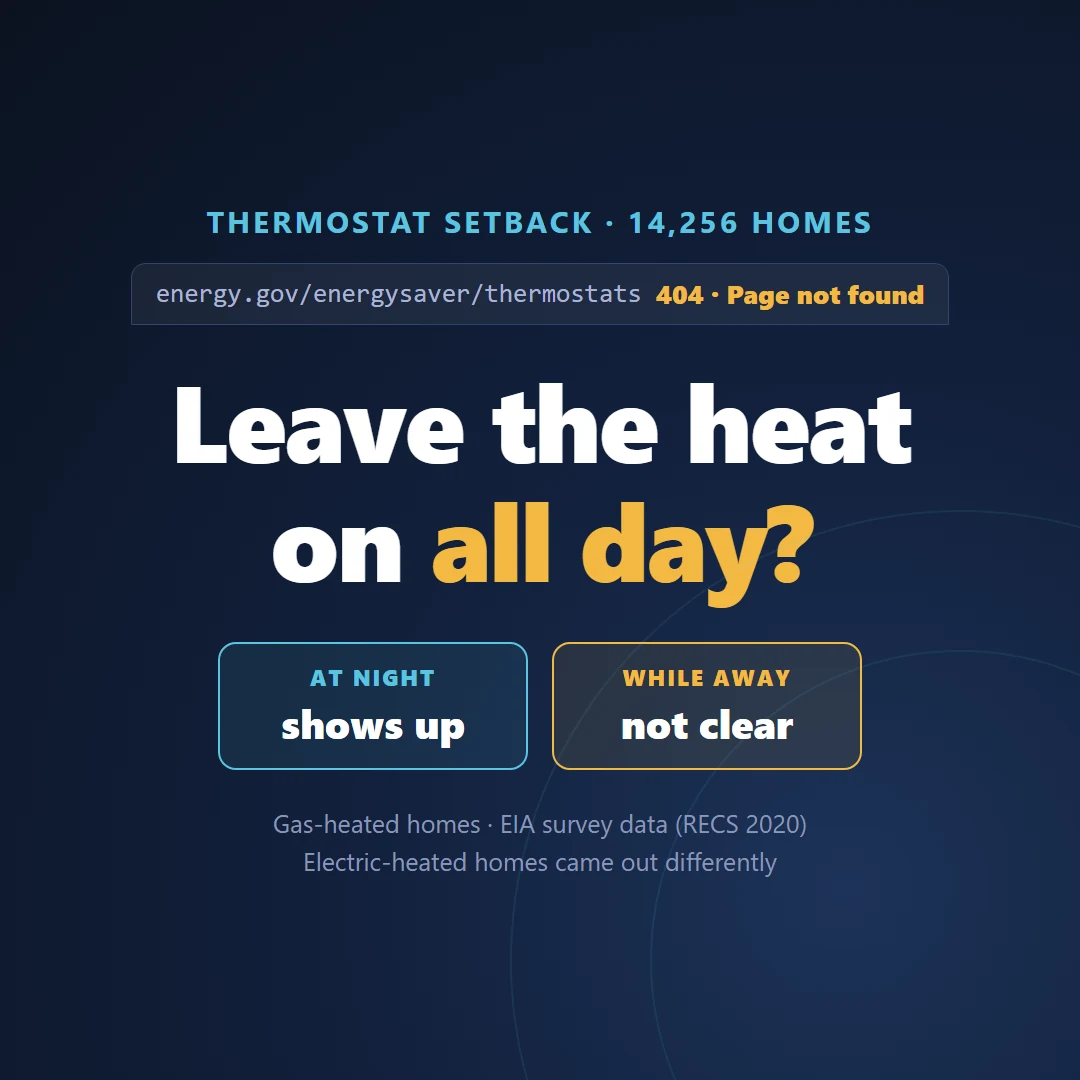
Is it cheaper to leave the heat on all day, or turn it down?
Most answers cite one source: the U.S. Department of Energy. Turn your thermostat back 7–10°F for eight hours a day, it says, and you can save as much as 10% a year.
Last updated: 17 October 2026 · Figures and rules in this post are current as of this date.
On October 17, 2026, I went to read that source.
energy.gov/energysaver/thermostats returned a 404.
So did the programmable-thermostats page. And the heat-pump page. And a fourth.
The number is still everywhere. The page it came from isn't.
I didn't want to repeat a figure I couldn't read. So I found the page in an archive. I tracked down the 1997 fact sheet behind the other famous rule, "1% per degree." Then I opened the government's own household survey and ran the numbers myself.
In gas-heated homes, turning the heat down at night showed up clearly. Turning it down while the house was empty did not. Electric-heated homes told a different story. And my first version of the analysis had a flaw I'll show you.
Prices, links and page statuses in this post were checked on October 17, 2026.
Why can't you find the DOE thermostat advice anymore?
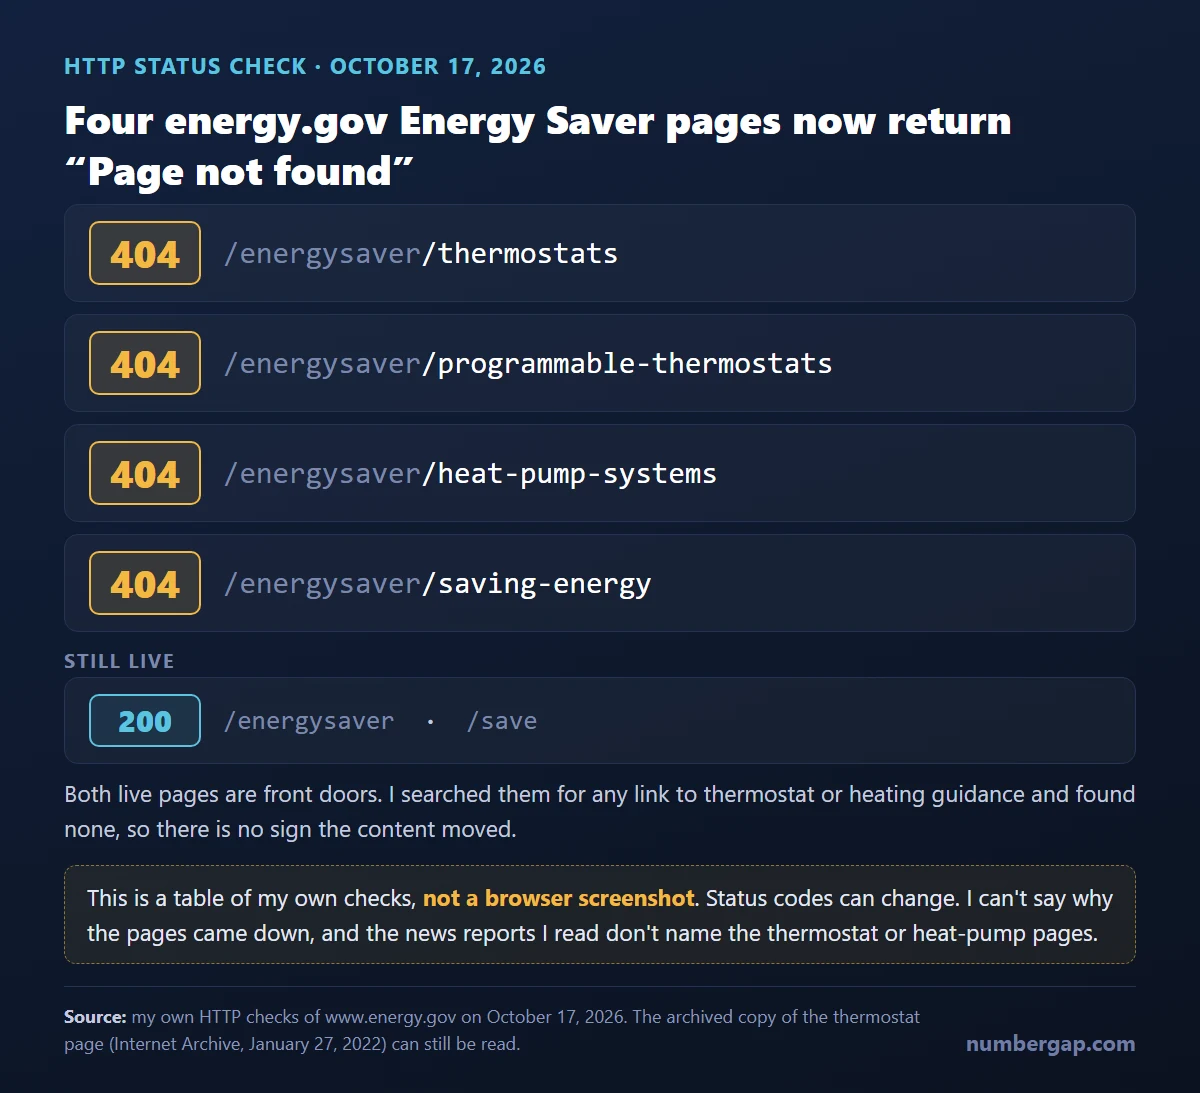
Because the pages now say "Page not found." I checked six URLs on October 17, 2026.
| URL on energy.gov | Status |
|---|---|
| /energysaver/thermostats | 404 |
| /energysaver/programmable-thermostats | 404 |
| /energysaver/heat-pump-systems | 404 |
| /energysaver/saving-energy | 404 |
| /energysaver | 200 |
| /save | 200 |
The two live pages are the section's front doors. I searched both for any link to thermostat or heating guidance. I found none, so there's no sign the content moved.
Source: my own HTTP checks on October 17, 2026. Page statuses can change.
Something large happened to this part of the website this summer. Government Executive, Canary Media and Mother Jones all reported in July 2026 that the Energy Department took down more than 1,600 Energy Saver pages. The coverage cites a Guardian analysis of federal traffic data: more than 300 of the removed pages had drawn about 160,000 views in the 30 days before they disappeared.
Source: Government Executive, July 2026; Canary Media, July 22, 2026; Mother Jones, July 2026. These are news reports, not DOE statements.
Here is what I can't tell you.
The articles I read name the cooling-temperature guidance, DIY home energy assessments, appliance-shopping pages and cool-roof guides. I didn't find one that names the winter thermostat page or the heat-pump page. So "DOE deleted its heating advice" is my inference from four 404s. Nobody reported it.
And why? DOE didn't explain, according to the coverage. I'm not going to guess.
A missing page tells you nothing about whether the advice was right. It only means you can no longer check the source. We covered the cooling-side pages in our summer piece on leaving the AC on.
Where does "save 10% by turning it back 7 to 10 degrees" actually come from?
It comes from a DOE Energy Saver page, and I can still read it because the Internet Archive saved a copy on January 27, 2022. Here's the sentence.
You can save as much as 10% a year on heating and cooling by simply turning your thermostat back 7°-10°F for 8 hours a day from its normal setting. The percentage of savings from setback is greater for buildings in milder climates than for those in more severe climates.
Source: DOE Energy Saver, "Thermostats," archived January 27, 2022 (since removed from energy.gov). Federal agency page. The capture shows no "last updated" date, and I couldn't retrieve a 2024–2026 version, so I can't say whether the wording changed before the removal.
Three conditions are packed into that sentence. Most retellings drop all three.
- It's heating and cooling combined. One figure, no split. "DOE says 10% off your heating bill" isn't what it says.
- It's a ceiling. "As much as."
- It's eight hours a day.
The other famous rule is "1% per degree." It isn't on that page. I searched the archived text for "1%", "per degree", "each degree" and "every degree." No hits.
It's in a 1997 fact sheet: DOE/NREL Fact Sheet 215, Automatic and Programmable Thermostats, March 1997, produced for DOE by NREL's Energy Efficiency and Renewable Energy Clearinghouse.
By turning your thermostat back 10° to 15° for 8 hours, you can save about 5% to 15% a year on your heating bill — a savings of as much as 1% for each degree if the setback period is eight hours long.
Source: DOE/NREL Fact Sheet 215, March 1997. Federal lab document, 29 years old, heating only. I read it through a Wayback Machine copy because the original NREL address wouldn't load.
Same hedges: "as much as," "eight hours." This time it's heating only.
Look at the arithmetic, though. Ten to 15 degrees at 1% each would be 10% to 15%. The sheet says 5% to 15%. So "1% per degree" is a rule-of-thumb ceiling, not a straight line. That's my reading, not DOE's.
Plenty of commercial and state pages repeat "1% per degree" and credit DOE without a link. I didn't open them all. The only DOE-produced source I found for it is the 1997 sheet.
| DOE page (archived 2022) | DOE/NREL fact sheet (1997) | |
|---|---|---|
| Setback | 7–10°F, 8 hours a day | 10–15°F, 8 hours |
| Saves | As much as 10% a year | About 5–15% a year; as much as 1% per degree |
| Applies to | Heating and cooling combined | Heating |
| "1% per degree" | Not on the page | Yes |
The two numbers everyone quotes come from two documents, 25 years apart, about two different things.
They agree on one point: how long the house stays cooler matters. Eight hours is in both.
Does turning the heat down actually save money? What federal survey data show
In gas-heated homes: overnight, yes. While nobody's home, I couldn't find an effect. In electric-heated homes, the pattern flips.
That comes from the federal government's own household survey: the Energy Information Administration's Residential Energy Consumption Survey, 2020 edition (RECS). The public file covers 18,496 homes and 799 variables, and weighted it stands in for about 123.5 million U.S. homes. It asks each household what temperature it keeps the thermostat at when someone's home, when nobody's home, and at night. It also carries each home's annual energy use, based on utility supplier data.
I looked at two groups. The first is 9,286 homes whose main heating fuel is natural gas and that have gas billing data. The second is 4,970 homes heated mainly with electricity. Together that's the 14,256 homes in the headline.
For each home I measured two kinds of setback. The away setback is the gap between the "someone's home" setting and the "nobody's home" setting. The night setback is the gap between the daytime setting and the overnight one.
Then I asked: among homes of similar size, climate, age, type and insulation, how does annual energy use change with each extra degree of setback? For gas homes I used total gas use. For electric homes, total kilowatt-hours. Those totals include water heating and cooking, and for electric homes lights, appliances and summer cooling too. So the thermostat's effect gets diluted. I added controls for water-heating fuel, range fuel and household size to blunt that.
| Group (energy measure) | Homes | Away setback | Night setback | Usual (home) setting |
|---|---|---|---|---|
| Gas main heat (total gas use) | 9,286 | −0.14% (0.22) | −1.13% (0.24) | +3.27% (0.26) |
| …gas central heat only | 7,970 | −0.08% (0.22) | −1.03% (0.19) | +3.22% (0.23) |
| Electric main heat (total kWh) | 4,970 | −0.65% (0.26) | −0.34% (0.29) | +1.58% (0.21) |
Cells show the change in annual use per 1°F, with the standard error in parentheses.
Source: EIA, Residential Energy Consumption Survey 2020, public microdata file v7 — federal survey data. The regression is my own calculation; standard errors use EIA's replicate weights.
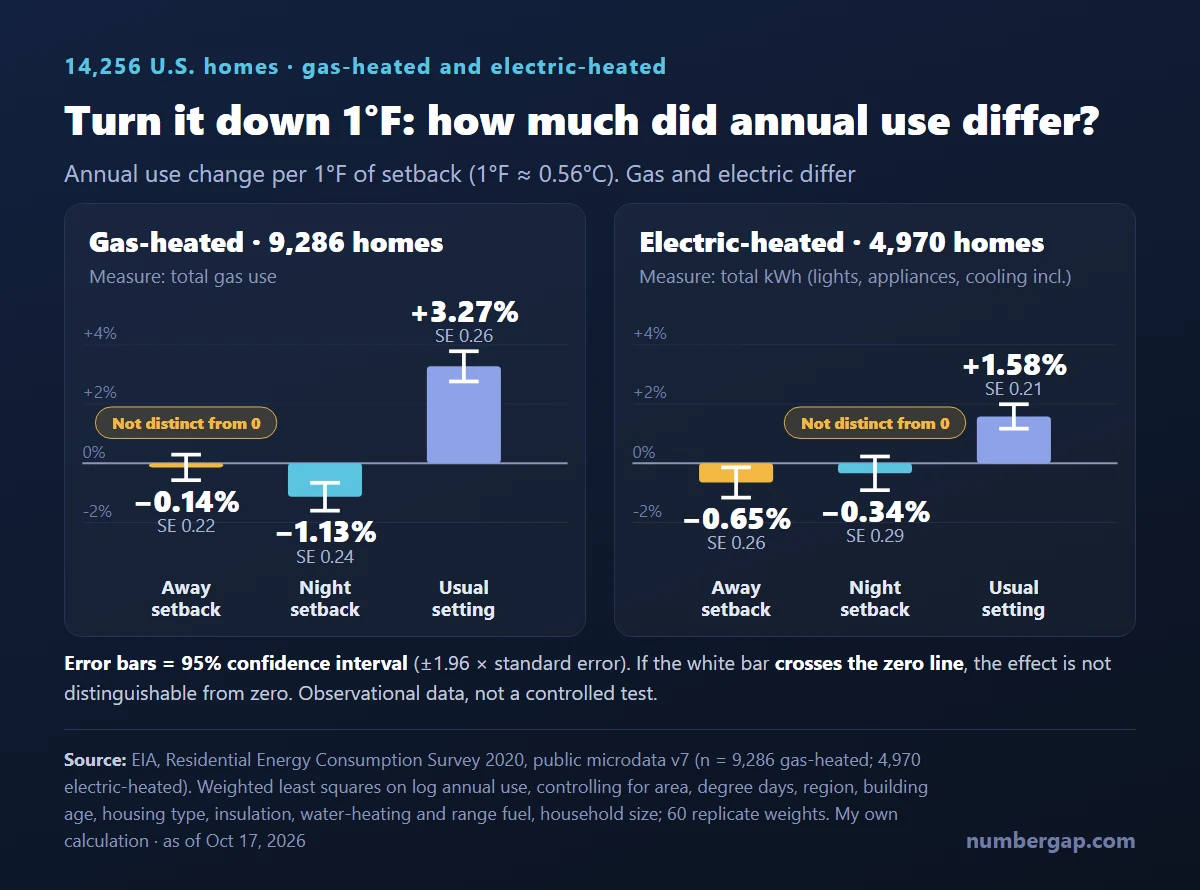
Start with gas. Three lines.
The away setback is indistinguishable from zero. Minus 0.14%, with a standard error of 0.22.
The night setback is not. About 1.1% less gas per year for each degree, and it holds up statistically.
The usual setting is the biggest lever of the three: about 3.3% per degree. That's a comparison across homes, not a promise about yours.
Electric homes don't follow the same pattern. Here the away setback is the one that shows up (−0.65%, standard error 0.26) and the night setback doesn't (−0.34%, standard error 0.29).
I could have shown you only the gas rows. The story would be cleaner. It would also be cherry-picked.
I see two candidate explanations. A home's electricity total carries everything: lights, appliances, summer cooling. That can bury a heating signal. And electric-heated homes tend to sit in milder regions. Both are my reading, and I can't tell which one is doing the work.
So the honest sentence is: it depends on the fuel.
Two plain facts about behavior. Across all heated homes in the survey, 51.7% report no setback when nobody's home, and 56.7% report none at night. Among the homes that do set back, the median is 4°F either way.
Back to gas. Why would the same act, turning the heat down, show up at night and vanish when you leave?
The clue was DOE's own sentence. Remember its three conditions. I took a setback inside its range, 8°F, and put it through the gas night coefficient: 8.7% less gas per year.
DOE's ceiling is 10%, and it's heating plus cooling. Mine is total gas use in gas-heated homes, heating plus hot water and cooking. Same order of magnitude. Because mine is diluted, a heating-only number would run higher. By how much, I can't say.
But the match tells you where to look. The condition in DOE's sentence was eight hours a day.
Sleep meets that condition. A quick errand doesn't. A workday might. The survey never asks how long anyone is gone, so I can't prove duration is the reason. It's my reading.
The 1997 fact sheet is more optimistic about short setbacks. It says significant savings are possible for as little as four hours a day.
There's a second possible explanation that has nothing to do with duration. RECS 2020 describes the year 2020, and the survey ran from August 2020 to April 2021. Many people were home. If "away" was rarer than usual, the away coefficient could sit near zero for that reason. I can't tell how much of it is the pandemic, so I'm not going to claim any.
Now the flaw I mentioned.
This table is my second attempt. The first time, I regressed the thermostat settings against EIA's estimate of each home's space-heating energy. It looked great: about 1.7% less heating energy per degree of night setback (gas central-heat homes, EIA-model basis), and nothing for away setbacks. Same pattern as the table above, with bigger numbers.
Then I read EIA's technical documentation, and one sentence stopped me.
The base temperature used for calculating HDDs for a particular home is set by the state where it is located, modified by their reported thermostat setpoints.
Source: EIA, 2020 RECS Consumption and Expenditures Technical Documentation Summary, May 2025 — federal technical documentation.
Reported thermostat setpoints are an input to the model that produces the heating estimate. I was regressing a model's output on the model's input. Part of any relationship I found was EIA's assumption read back to me.
So I pulled that result from the headline spot. I rebuilt the analysis on something the model doesn't touch: each home's total gas or electricity use from utility records. The numbers got smaller. 1.7% became 1.1%. Whether that gap is dilution from hot water and cooking or the model effect, I don't know.
It's the thing this blog does to other people's numbers. This time it was my own.
One more cross-check, on the big lever. An EIA analysis from December 2000, using 1997 survey data, estimated that each 1°F lower setting would have cut space-heating use by 5% for natural gas, 6% for electricity and 4% for fuel oil. My 3.3% for gas is smaller, which fits: mine is total gas use, diluted by water heating and cooking. That analysis is 26 years old and a modeled counterfactual, not a field trial.
Scale EIA's 5% to the eight hours of a night (one third of a day) and you get about 1.7% per degree. My diluted night figure is 1.1%. The 1997 fact sheet's ceiling is "as much as 1%." Three different methods, one order of magnitude. That's all I'd claim.
Source: EIA, "Winter Energy Savings from Lower Thermostat Settings," December 12, 2000 — federal analysis of 1997 RECS data; modeled, not measured.
Doesn't the furnace work harder to reheat the house?
Not enough to erase the savings. That's DOE's position in 1997 and in 2022, and the one careful field test I found agrees.
The objection is old enough that DOE wrote it down. Here's the 2022 version.
A common misconception associated with thermostats is that a furnace works harder than normal to warm the space back to a comfortable temperature after the thermostat has been set back, resulting in little or no savings. In fact, as soon as your house drops below its normal temperature, it will lose energy to the surrounding environment more slowly. During winter, the lower the interior temperature, the slower the heat loss. So the longer your house remains at the lower temperature, the more energy you save, because your house has lost less energy than it would have at the higher temperature.
Source: DOE Energy Saver, "Thermostats," archived January 27, 2022 — federal agency page.
The 1997 sheet says the misconception "has been dispelled by years of research and numerous studies." Then it does the bookkeeping.
The fuel required to reheat a building to a comfortable temperature is roughly equal to the fuel saved as the building drops to the lower temperature. You save fuel between the time that the temperature stabilizes at the lower level and the next time heat is needed.
Source: DOE/NREL Fact Sheet 215, March 1997 — federal lab document.
Read the second sentence twice. The savings don't come from the drop or from the recovery. They come from the time spent at the lower temperature. That's why duration keeps turning up.
The sheet also makes a point about equipment. A furnace puts out the same amount of heat no matter how high the thermostat is set. The variable is how long it stays on. It runs longer, not harder.
Some arithmetic of my own. Heat loss follows the gap between inside and outside. Hold a house at 70°F on a 30°F day and the gap is 40°F. Let it sit at 62°F and the gap is 32°F, so heat leaks out 20% more slowly for as long as it stays there. That's the formula, not a measurement.
For a measurement, the best I found was a pair of twin houses in Ottawa.
In 2003, a team at the Canadian Centre for Housing Technology (Manning, Swinton, Szadkowski, Gusdorf and Ruest, authors of the paper behind a 2005 CMHC summary) had two identical, heavily instrumented, super-insulated houses side by side. The same weather hits both. They held both at 22°C (71.6°F) for 28 benchmark days. Then one house started setting back. Heat came from a mid-efficiency gas furnace.
| Schedule (from 22°C / 71.6°F) | Predicted annual furnace-gas saving |
|---|---|
| Night only: 18°C (64.4°F) from 11 p.m. to 6 a.m., 7 hours, −7.2°F | 6.5% |
| Night and day: 18°C, 11 p.m.–6 a.m. plus 9 a.m.–4 p.m., 14 hours, −7.2°F | 10.0% |
| Night and day: 16°C (60.8°F), 14 hours, −10.8°F | 13.0% |
Source: Canada Mortgage and Housing Corporation, Research Highlight, Technical Series 05-100, "Effects of Thermostat Setting on Energy Consumption," June 2005 — government research summary. Annual figures are predictions scaled up from part-season tests. The underlying peer-reviewed paper (ASHRAE Transactions 113(1), 2007) I couldn't retrieve.
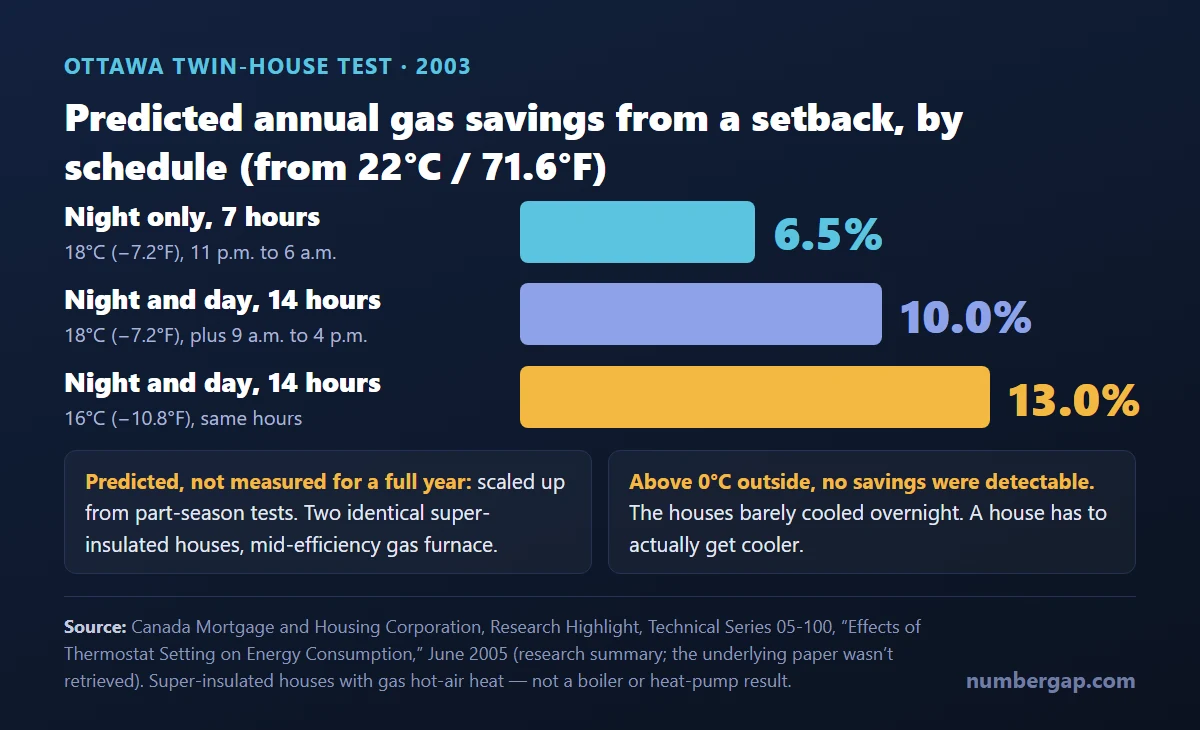
The biggest saving came on the coldest, cloudiest day, with the 16°C schedule: the furnace ran 228 minutes less and saved 163 MJ of gas. Recovery from a winter setback took under two hours, and usually under one.
And then there's the line that matters for the away-setback puzzle. When it was above 0°C (32°F) outside, the researchers wrote, "the net benefits were not detectable. These R-2000 houses don't have time to cool down significantly overnight to show an appreciable saving."
A house has to actually get cooler to save anything.
The lab number isn't the real-world number, either. A 2016 ACEEE paper by Parker, Sutherland and Chasar summarizes earlier work that shows the gap. I read that paper but not the underlying reports, so these figures are second-hand.
- A 1988 Oak Ridge National Laboratory study (Levins) measured 20% heating savings from setback in instrumented test homes. ACEEE calls those homes "unoccupied." The ORNL title says "occupied." I can't resolve that.
- Blasnik, cited by Bailes (2012), found 5–8% in occupied northeastern homes between 1998 and 2008, "less than half of identified potentials."
- Roberts and Lay (2013) measured 20 homes in New York. Nighttime temperatures were only about 3°F lower than midday.
People set back less than the lab does, and less long.
| Source | What it found | How solid |
|---|---|---|
| DOE page, archived 2022 | As much as 10% a year, heating and cooling, 7–10°F for 8 hours | Agency guidance |
| DOE/NREL, 1997 | About 5–15% a year on heating; as much as 1% per degree at 8 hours | Agency guidance |
| Ottawa twin houses, 2003 | 6.5%–13% a year, gas furnace, super-insulated | Measured, annualized |
| Oak Ridge test homes, 1988 | 20% | Second-hand (via ACEEE) |
| Occupied northeastern homes, 1998–2008 | 5–8% | Second-hand (via ACEEE) |
| My RECS 2020 analysis, gas homes | About 8.7% a year for an 8°F night setback (total gas use) | Observational; utility-bill basis |
My plain-English reading: for a gas furnace or boiler, a sensible nightly setback typically saves roughly 5–10% of the heating bill in the measurement studies. DOE's ceiling is "as much as 10%." The 13–20% results show up only with deep, long setbacks.
One boundary. "Setback always wins" assumes the equipment is just as efficient while it recovers as it is in steady state. A furnace or boiler roughly is. A heat pump leaning on resistance backup is not.
Should you set back a heat pump? The evidence points both ways
It depends on the equipment and the controls, and the direct evidence is thin. DOE has warned for 30 years that a setback can cancel the savings. The best recent field trial agrees, in 14 homes. Vendor-published studies report the opposite. My own survey run can't separate heat pumps from other electric heat.
What DOE has said for 30 years
Both the 1997 sheet and the 2022 page carry a heat pump warning. The 2022 wording:
Programmable thermostats are generally not recommended for heat pumps. ... when a heat pump is in its heating mode, setting back its thermostat can cause the unit to operate inefficiently, thereby canceling out any savings achieved by lowering the temperature setting. Maintaining a moderate setting is the most cost-effective practice. Recently, however, some companies have begun selling specially designed programmable thermostats for heat pumps, which make setting back the thermostat cost-effective.
Source: DOE Energy Saver, "Thermostats," archived January 27, 2022. The 1997 NREL fact sheet carries nearly the same note.
Look at the verbs: "can cause," "generally not recommended." And the exception: special thermostats "make setting back the thermostat cost-effective." It never says "never set back a heat pump."
The mechanism is the electric backup. Ask a heat pump to recover quickly from a deep setback in cold weather and the thermostat may call on resistance strips, often labeled "aux" or "emergency" heat. Google's Nest help page says that "AUX heat can cost about 2 to 5 times as much as running your heat pump." That's a manufacturer's statement, not a lab measurement.
What a 14-home field trial found
The Bonneville Power Administration had a puzzle. Its heat pump field study kept showing higher-than-expected morning peaks at mild temperatures. The team suspected that setbacks were triggering the electric backup. So they tested it.
In January 2025, 14 homes with ducted heat pumps ran an 8-hour overnight setback of 3–5°F every day. In February they held a flat temperature. The June 2026 report, prepared by Larson Energy Research, OTS Energy and Ecotope for the Washington State University Energy Program, says:
The thermostat setback study appears to indicate that thermostat setbacks are not clearly producing energy savings for these homes and, in some cases, are causing energy penalties. The setbacks are also contributing to utility peaks.
The numbers behind it:
- At 6 a.m., average power draw with setbacks was approximately double what it was with a flat setting.
- At the two worst homes, average hourly power during setback recovery exceeded 10 kW in January, against about 2 kW for the same hours in February.
- Across the ducted homes, about 44% of indoor-unit energy was used in a five-hour window, 5 a.m. to 9:59 a.m.
- At one home, the system ran longer without a setback, yet used about 10 kWh less on the coldest overlapping days.
How many homes lost? The report disagrees with itself. One section says 10 of 14 homes landed within ±10% of the same energy either way. Another says 9 of 14, with the other 5 using at least 10% more with setbacks. I'd say roughly a third of the homes used 10% or more extra, and cite both versions.
Source: Bonneville Power Administration, High-Performance High-Capacity Heat Pump Field Study Report, June 2026 — federal power marketing agency. I read it through a Wayback copy. Sections 7.6 and 10.3 give different site counts.
Now the limits, in the report's own words. The sample "is not random or representative." It's small. The systems are high-performing variable-speed models. "Therefore, the results here should not be extrapolated." And January-then-February is a before-and-after, not a randomized crossover.
The report also points to a fix: "Thermostats with shallow setbacks or advanced control logic can help avoid unnecessary ER use during morning warm-up."
What my survey run can't say about heat pumps
The electric-heated group in my table lumps heat pumps and resistance heat together. Its result was mixed: an away setback showed up, a night setback didn't. And the total-kWh measure carries lights, appliances and cooling. So I can't say anything specific about heat pumps from it.
My first-pass run did split them out. It gave heat-pump homes about 1.8% less heating energy per degree of night setback, with a large standard error (EIA-model basis). But that's the circular run I told you about, so I'm not counting it as evidence.
Why the evidence might not agree
I don't know, and I won't pretend to. The candidates are equipment (BPA's units are high-end variable-speed models), measurement (BPA metered real homes across two months; surveys rely on self-reported settings), and setback depth. Different eras of equipment matter too. A 1978 simulation by Bullock at Carrier concluded that nighttime setbacks of 5°F or more could raise heat pump energy use, but that was a single-speed model from the 1970s.
On the other side, a vendor-published summary: Nest's 2015 white paper reports that 185 Oregon heat-pump homes cut electric heating use 12% (781 kWh a year per home), which the evaluator credited to Nest's Heat Pump Balance feature. Treat it as a vendor-published summary of a third-party study, measured against what those homes did before.
| Statement | Support |
|---|---|
| DOE has warned for about 30 years that setback on a conventional heat pump can cancel the savings | Confirmed: DOE/NREL 1997; DOE page 2022 |
| Backup resistance heat costs 2–5 times as much as the heat pump | Google Nest Help; a vendor statement |
| In a 2025 trial of 14 ducted, high-end heat pumps, a 3–5°F setback did not clearly save energy, and roughly a third of homes used 10% or more extra | BPA, June 2026; small, non-random, don't extrapolate |
| Setback on a heat pump always loses money | Not supported. The sources say "can," and 9–10 of 14 homes were within ±10% |
| Smart controllers fix it | Not established. Oregon's 12% is a vendor-published summary |
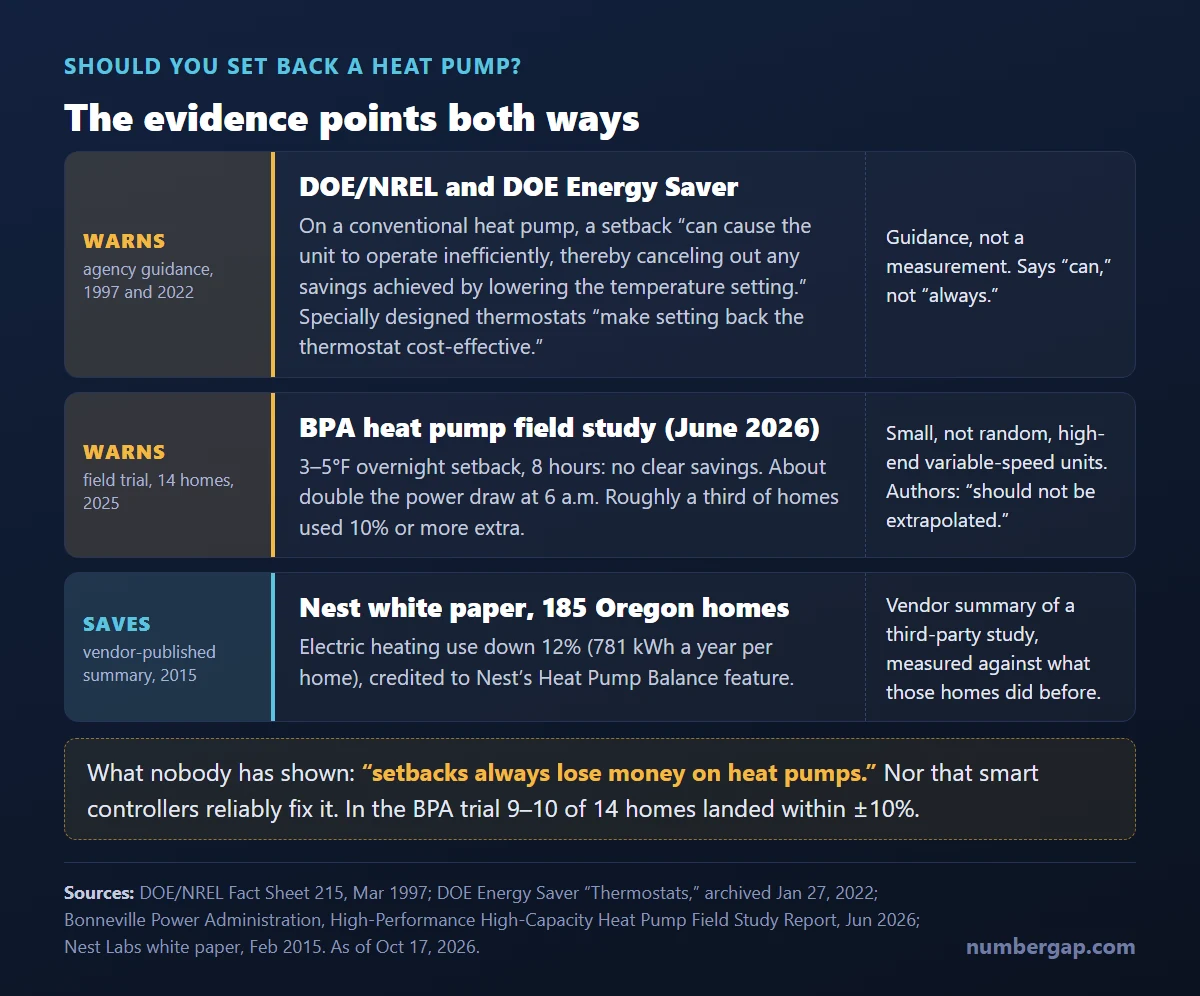
So here's the sentence I'm comfortable with. For a heat pump, the savings from a setback can shrink or disappear depending on equipment and controls, and the evidence conflicts.
I'm not comfortable with "setbacks lose money on heat pumps." Nobody has shown that.
How much is a thermostat setback worth in dollars?
For an average home: tens of dollars a winter, not hundreds. That's my reading of the arithmetic below.
Start with the EIA's Winter Fuels Outlook, released October 6, 2026. It gives average household spending from November 2026 through March 2027, by main heating fuel.
| Main heating fuel | Winter spend | Change vs. last winter | Price assumed |
|---|---|---|---|
| Natural gas | $640 | −9% | $13.44 per Mcf |
| Electricity | $1,196 | +4% | 18.23¢ per kWh |
| Propane | $1,246 | −3% | $2.52 per gallon |
| Heating oil | $2,115 | +21% | $5.26 per gallon |
Source: EIA, Winter Fuels Outlook 2026–27, October 6, 2026 — federal forecast. Assumes 3,155 heating degree days nationally.
Here's the trap. Those dollars are for all uses of that fuel in the home, not heating alone. EIA says so: the consumption values are "for all end uses associated with a home's main heating fuel." For gas, that includes water heating and cooking. For electricity, EIA subtracted air conditioning but not lights and appliances.
So $640 × 5–10% overstates the savings. Treat it as a ceiling: at most $32 to $64 for a gas home, at most $60 to $120 for an electric one. And for a heat pump with backup strips, the real number could be near zero or negative.
Also, gas-heated and electric-heated homes are different populations. Electric homes cluster in the South, where winters are milder. $640 against $1,196 is not a fuel price comparison.
For gas homes there's a tighter way, using my own coefficient. It measures the change in total gas use, so apply it to the same all-uses base, $640.
| Overnight setback | Estimated change in gas use | On $640 of winter gas spend |
|---|---|---|
| 2°F | ≈ 2.2% | ≈ $14 |
| 4°F (the median among homes that set back) | ≈ 4.4% | ≈ $28 |
| 8°F | ≈ 8.7% | ≈ $56 |
Compounded from the gas night coefficient (−1.13% per °F). Observational. The coefficient is a share of annual gas use and the $640 covers only November through March, so treat these as ballpark figures, not forecasts. Your house will differ.
For comparison, the usual-setting coefficient says 1°F lower all day goes with about 3.3% less gas, roughly $21 on the same base. Again, a comparison across homes.
I'm not putting a dollar figure on electric homes. Their result was too different to turn into one number.
Where you live moves the dollars more than the setback does. In January 2026, residential electricity averaged 17.45¢ per kWh nationally, from 10.92¢ in North Dakota to 39.79¢ in Hawaii. Residential gas averaged $13.96 per Mcf, from $6.71 in Idaho to $25.77 in Massachusetts.
| Region | Gas winter spend | Electric winter spend |
|---|---|---|
| Northeast | $879 | $1,637 |
| Midwest | $613 | $1,380 |
| South | $511 | $1,079 |
| West | $590 | $1,151 |
Source: EIA Winter Fuels Outlook, October 6, 2026 (regional spend); EIA monthly price data for January 2026, queried October 17, 2026. All end uses, not heating alone.
How many homes does any of this describe? Three federal sources give three answers.
| Source | Gas as main heat | Electricity as main heat |
|---|---|---|
| RECS 2020 (123.5 million homes) | 51% | 34% |
| American Community Survey 2024, via EIA (Oct. 2025) | 47% | 42% |
| EIA Winter Fuels Outlook (Oct. 2026), ACS 2024 | 46% | — |
Different surveys, different years, different definitions of "main." I can't tell which ACS table explains 46% versus 47%. Treat the fuel mix as "about 46–47% gas, 42–43% electric," and note that "electric" mixes resistance heat and heat pumps. In RECS, about 16.1 million homes, roughly 13%, list a central heat pump as main heating.
By EIA's 2026 household counts, gas, propane and oil together cover about 53% of households. That's the group where the setback logic is simplest. (My arithmetic: 71.5 million of 134.4 million.)
What this analysis can't tell you, and how to rerun it
Seven limits. I'd rather you read them here than discover them later.
- It's observational, not causal. I accounted for size, heating degree days, climate region, age, housing type, insulation, water-heating fuel, range fuel and household size. I could not account for furnace efficiency, who's home when, or income.
- The energy measure isn't heating alone. Total gas use includes hot water and cooking; total kWh includes lights, appliances and cooling. That dilutes the thermostat effect, so the coefficients run smaller than a heating-only number would. They're conservative.
- Settings are self-reported. Households told EIA what they set. These aren't thermostat logs.
- It's the pandemic year. Consumption year 2020; survey fielded August 2020 to April 2021. "Away" may have been rarer than usual, and I can't say how much that moves the away coefficient.
- RECS doesn't ask how long. A setback's savings should grow with its hours, and I don't know the hours.
- Electric homes point the other way. Away setbacks show up and night setbacks don't. Reading only the gas rows would mislead.
- It measures energy, not dollars. Cost depends on fuel, location and rate plan.
Here's how I ran it. I fit a weighted least squares regression on the log of annual energy use. The controls were heated floor area, heating degree days, a construction-era band, climate region, housing type, a self-rated insulation score, water-heating fuel, range fuel and household size. Standard errors come from EIA's 60 replicate weights, with the jackknife factor 59/60 that EIA's microdata guide specifies.
The file is public. You can get the same numbers.
- Microdata (CSV, 56 MB): https://www.eia.gov/consumption/residential/data/2020/csv/recs2020_public_v7.csv
- Codebook: https://www.eia.gov/consumption/residential/data/2020/xls/RECS%202020%20Codebook%20for%20Public%20File%20-%20v7.xlsx
- Variance guide (replicate weights, jackknife): https://www.eia.gov/consumption/residential/data/2020/pdf/microdata-guide.pdf
- How EIA's heating model uses reported setpoints: https://www.eia.gov/consumption/residential/data/2020/pdf/2020%20RECS%20CE%20Methodology%20-%20Monthly%20Appendix%20-%20Final.pdf
- Variables I used:
BTUNG(annual total natural gas use),KWH(total electricity),TEMPHOME(setting when someone's home),TEMPGONE(nobody home),TEMPNITE(night),HDD65(heating degree days), and weightsNWEIGHTandNWEIGHT1–NWEIGHT60. The modeled variable I dropped after my first attempt isTOTALBTUSPH.
What I couldn't confirm:
- Whether the four thermostat and heat-pump pages were part of the July removal, and why any page came down.
- Whether DOE's thermostat wording changed between January 2022 and the removal.
- The Oak Ridge (1988) and Blasnik/Bailes (2012) figures, which I have only through ACEEE.
- The original Cadmus and Apex evaluations behind Nest's numbers, and the ASHRAE paper behind the Ottawa summary.
- Any national count of heat-pump homes that have electric backup strips. I found none, so I'm not stating one.
Frequently asked questions
Q. Is it cheaper to leave the heat on all day or turn it down when you leave?
A. None of the sources I found says leaving the heat unchanged is cheaper. DOE, the 1997 NREL fact sheet and the Ottawa twin-house test all find that a setback saves energy, and the savings grow with the hours the house stays cooler. In 9,286 gas-heated homes, a night setback showed up clearly (about 1.1% of gas use per °F) and an away setback showed no clear effect. Electric-heated homes pointed the other way, and heat pumps with electric backup are a separate question where the evidence conflicts.
Q. How much does turning the thermostat down at night save?
A. In my RECS 2020 analysis of gas-heated homes, about 1.1% of annual gas use per °F, or roughly 8.7% for 8°F. DOE's archived page says as much as 10% a year on heating and cooling for 7–10°F over 8 hours a day. The Ottawa test predicted 6.5% for a 7-hour, 7.2°F night setback in a super-insulated house. Occupied northeastern homes showed 5–8% in studies cited second-hand by ACEEE.
Q. Does turning the heat down save money if you're only gone a few hours?
A. I couldn't show it. The away setback in gas-heated RECS homes was indistinguishable from zero, but the survey doesn't ask how long people are out, and it describes 2020. In electric-heated homes an away setback did show up. The 1997 NREL sheet says significant savings are possible for as little as four hours a day. In the Ottawa test, savings weren't detectable above 0°C because the house barely cooled.
Q. Does a furnace work harder to reheat the house?
A. It runs longer, not harder. DOE (2022) and NREL (1997) both call the "works harder" idea a misconception. The fuel needed to reheat is roughly equal to the fuel saved while the house cools, so the savings come from the time spent at the lower temperature.
Q. Should I use a thermostat setback with a heat pump?
A. The evidence conflicts. DOE has said since 1997 that a setback can cancel the savings on a conventional heat pump, and that special thermostats can make it cost-effective. A 14-home BPA field trial (2026) found no clear savings and about double the 6 a.m. power draw, and its authors say not to extrapolate. My survey analysis can't separate heat pumps from other electric heat.
Q. How much does 1 degree save on heating?
A. It depends on what you change. "As much as 1% per degree" comes from a 1997 DOE/NREL fact sheet, for an 8-hour setback. In my RECS 2020 analysis of gas homes, a night setback was about 1.1% of gas use per °F and a lower usual setting about 3.3% per °F, both comparisons across homes. A 2000 EIA analysis of 1997 data put a lower all-day setting at 5% for gas, 6% for electricity and 4% for fuel oil.
Q. Why did the DOE thermostat page disappear?
A. I don't know, and I couldn't find a report that says. energy.gov/energysaver/thermostats returned a 404 on October 17, 2026. News outlets reported that DOE removed more than 1,600 Energy Saver pages in July 2026 without explaining. The coverage I read doesn't name the thermostat page.
Q. How much does it cost to heat a home for the winter?
A. EIA's Winter Fuels Outlook (October 6, 2026) puts average November–March spending at $640 for homes heated mainly with gas, $1,196 electric, $1,246 propane and $2,115 heating oil. Those figures cover all uses of that fuel, not heating alone, and gas and electric homes are different populations.
Q. What temperature should I set my thermostat to in winter?
A. DOE's archived 2022 page suggested around 68°F while you're awake, and lower while you're asleep or away. Among U.S. homes that do lower the setting, the median drop is 4°F.
What to do before the first cold snap
If you change one thing, change the overnight setting by a few degrees. That's where the evidence is.
In the data I ran, the median home that sets back drops 4°F, and my gas night coefficient puts that at about 4.4% of annual gas use. On a typical winter gas bill, that's tens of dollars, not hundreds.
If you have a heat pump with electric backup, don't copy a deep setback. In the BPA trial, the cost showed up at 6 a.m. Check what your thermostat does at wake-up time first. Shallow setbacks or recovery logic are what the report points to.
And if a number comes with no link you can open, treat it the way I treated the DOE page. Then treat your own numbers the same way. The sheet and the survey are still public. You can check them.
This post summarizes public documents and my own calculation from a federal survey. It isn't HVAC or financial advice.
If this was useful, come back for the next one.
Sources
U.S. Department of Energy and national labs
- DOE Energy Saver, "Thermostats" (archived January 27, 2022) — original page now returns 404
- DOE/NREL Fact Sheet 215, Automatic and Programmable Thermostats, March 1997 (archived copy)
- Bonneville Power Administration, High-Performance High-Capacity Heat Pump Field Study Report, June 2026
Energy Information Administration
- Residential Energy Consumption Survey 2020 microdata
- 2020 RECS Consumption and Expenditures methodology, monthly appendix
- 2020 RECS Consumption and Expenditures Technical Documentation Summary, May 2025
- Winter Fuels Outlook 2026–27, October 6, 2026
- Winter Energy Savings from Lower Thermostat Settings, December 12, 2000
- RECS 2020 Table HC6.4, Space heating in U.S. homes
- Today in Energy, October 10, 2025: electricity use is becoming more common for residential heating
Other research
- CMHC Research Highlight 05-100, "Effects of Thermostat Setting on Energy Consumption," June 2005
- Parker, Sutherland and Chasar, ACEEE Summer Study 2016
- Bullock (Carrier), ASHRAE Journal, 1978, OSTI record 6265622 — seen through the OSTI summary
Vendor documents (used only for what the vendor says about its own product)
News coverage of the DOE page removals
- Government Executive, July 2026
- Canary Media, July 22, 2026
- Mother Jones, July 2026


Comments
Post a Comment