Credit Karma Score vs FICO — Which Do Lenders Use in 2026?
You open the app on a Tuesday night. 740. Not bad.
Three weeks later you're sitting across from a loan officer, and she reads a different number off her screen. Lower. Enough lower that the rate she quotes isn't the one you'd been budgeting for.
Last updated: 5 September 2026 · Figures and rules in this post are current as of this date.
Nobody made a mistake. You were both looking at real credit scores. They were just different products, built by different companies, for different customers.
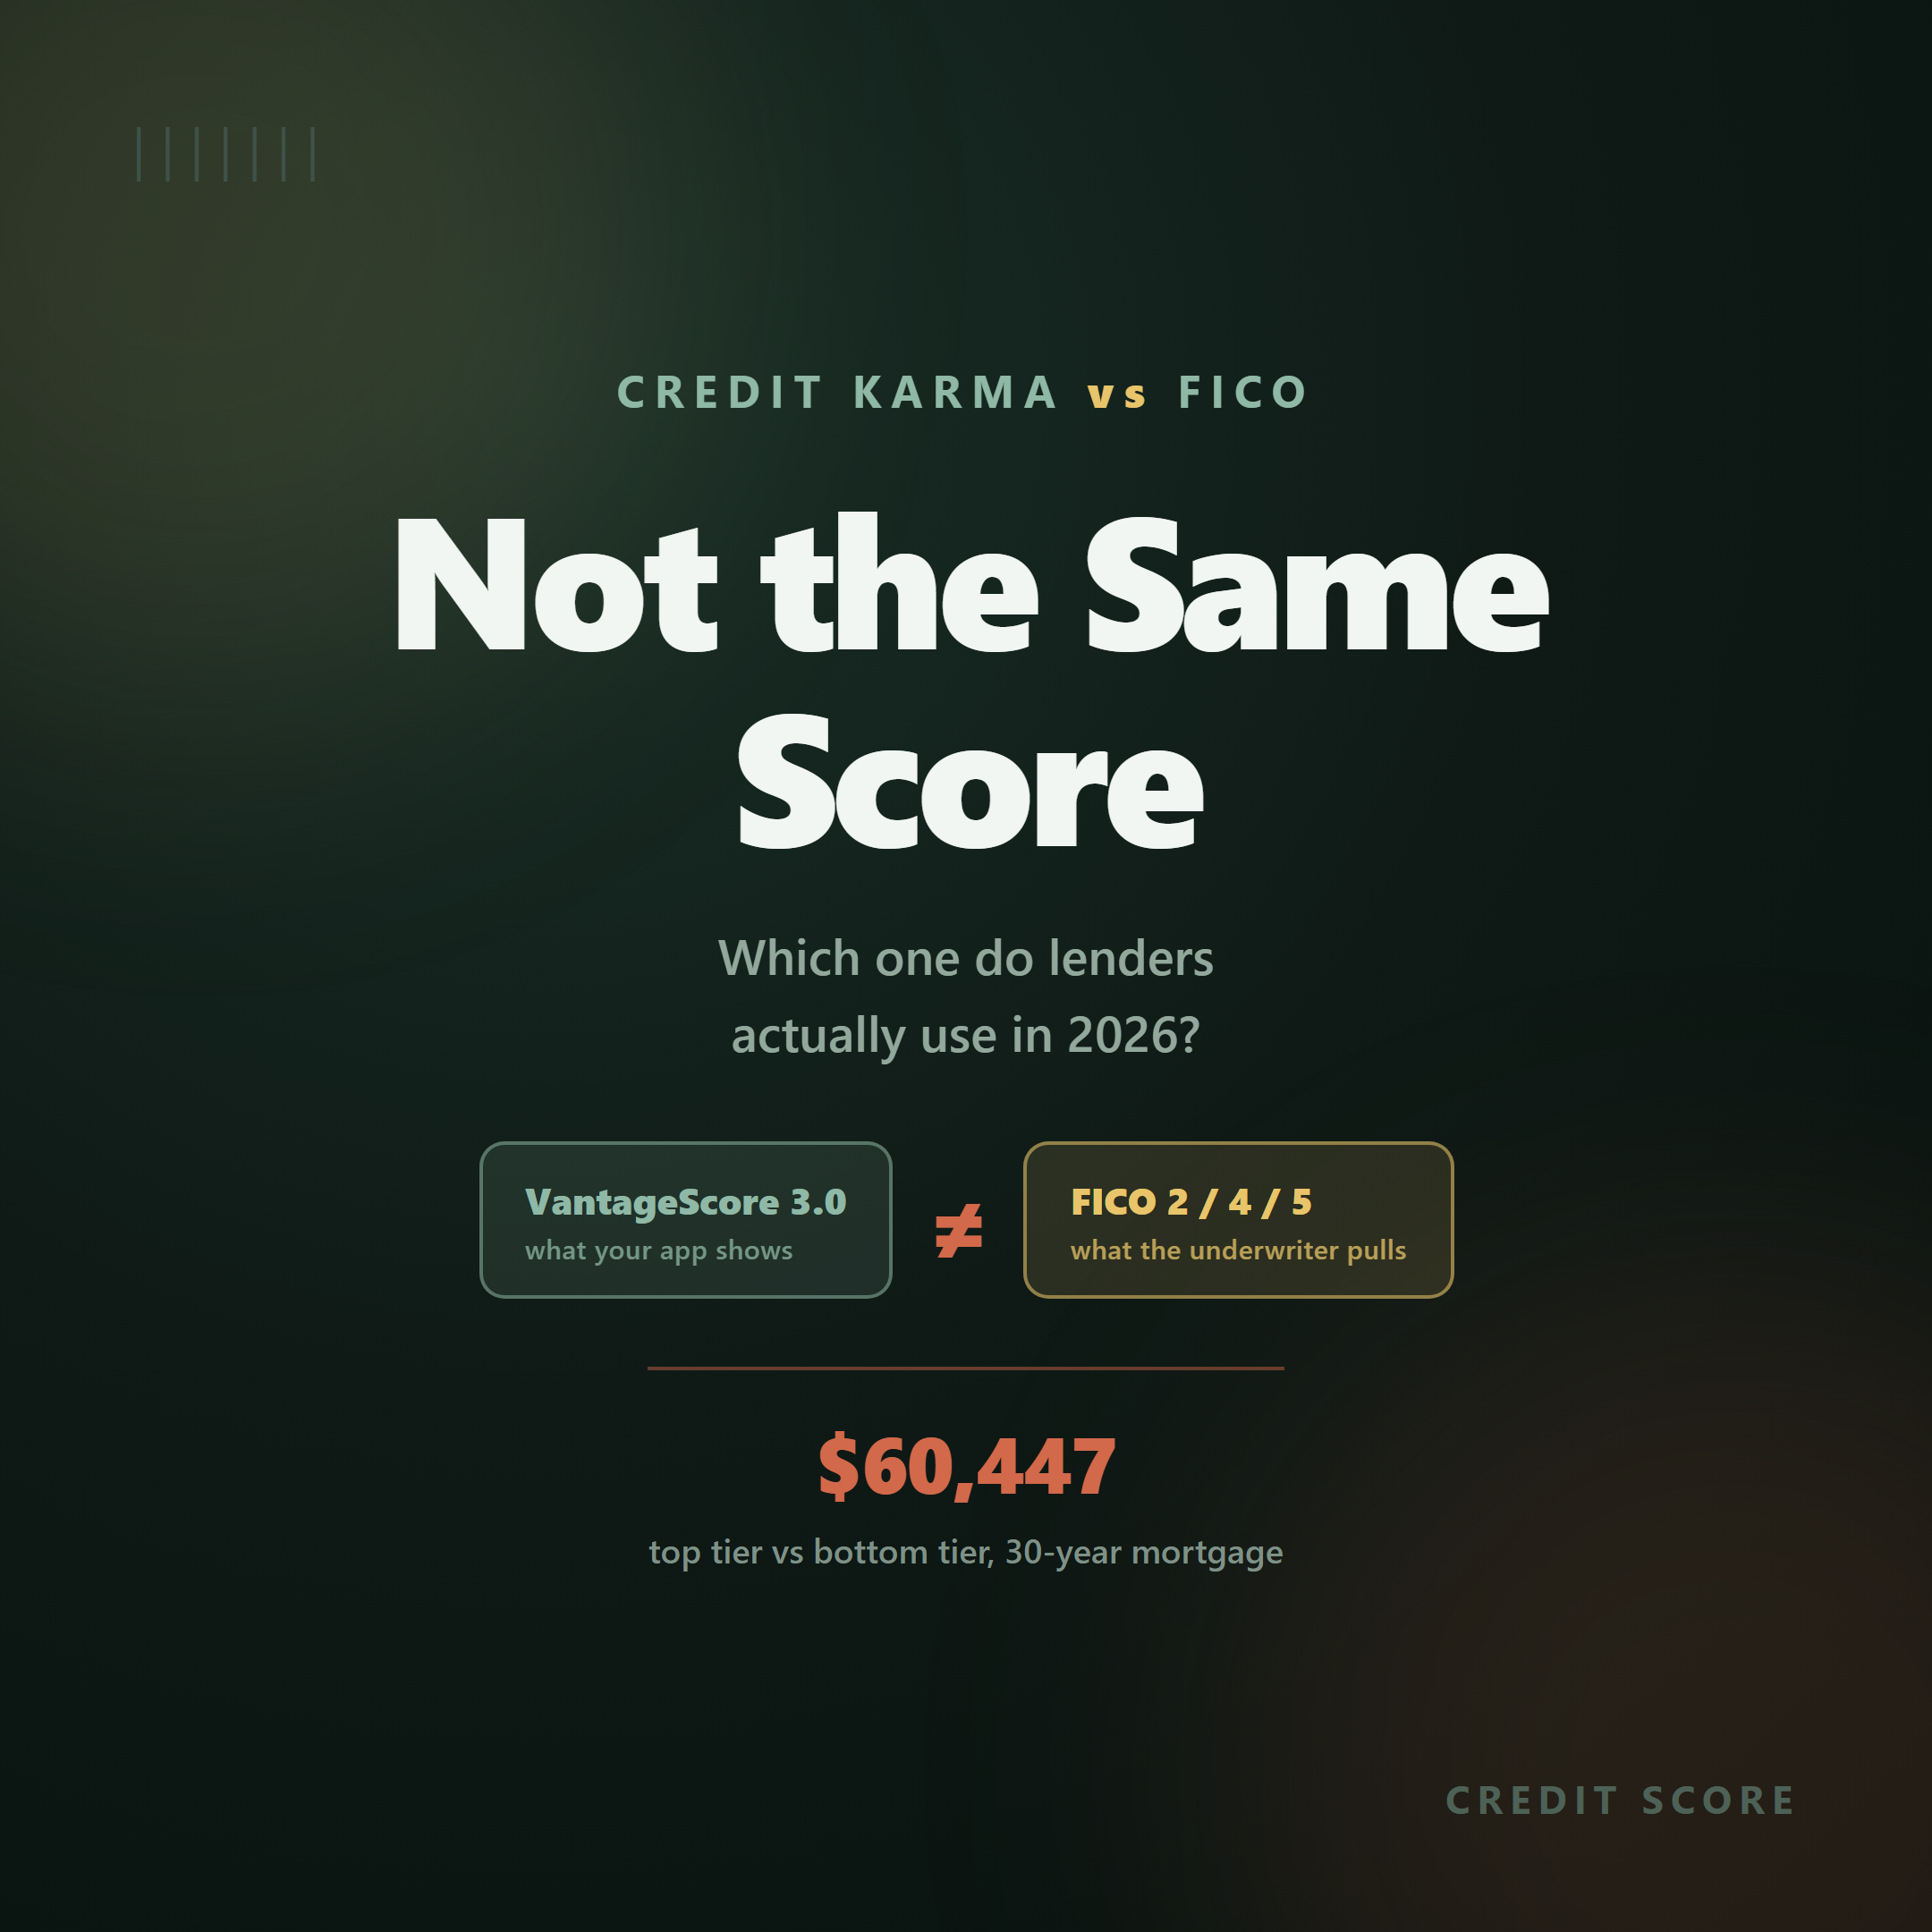
And here's why it's worth twenty minutes of your evening: on a 30-year mortgage, the distance between the top credit tier and the bottom one is about $168 a month and $60,447 in lifetime interest (more on where that number comes from in a minute). The gap between your app score and your underwriting score is usually much smaller than that — but it's often just big enough to move you one pricing tier. Which is exactly the amount that costs money.
Let's take this apart in plain English.
Why is my Credit Karma score higher than my actual score?
Short answer: because Credit Karma isn't showing you a FICO score at all. It's showing you a VantageScore — a different model, from a different company, built on data from only two of the three credit bureaus.
Specifically, Credit Karma shows VantageScore 3.0 from TransUnion and Equifax. It doesn't monitor Experian at all. (This is on Credit Karma's own product pages, and CNBC Select's comparison of the two confirms it.)
Meanwhile, a mortgage lender pulling your file the traditional way is looking at FICO Score 2, 4 and 5 — one from each of the three bureaus — and taking the middle one.
So line them up:
| Your free app | A mortgage underwriter | |
|---|---|---|
| Model | VantageScore 3.0 | FICO 2 / 4 / 5 ("Classic FICO") |
| Built by | VantageScore Solutions | Fair Isaac Corporation |
| Bureaus used | TransUnion, Equifax | All three, median of the three |
| Model generation | 2013-era | 1990s–2000s-era |
Almost every single input is different. Expecting those two numbers to match is like expecting your bathroom scale and the doctor's scale to agree to the ounce — except these two scales were also built by competitors who disagree about what a pound is.
There's an important nuance in which direction the surprise usually goes. CNBC Select's summary of consumer complaints put it well: the problem generally wasn't that Credit Karma scores were too low — it was that they were too high. People applied believing they had good or excellent credit, and the issuer's pulled score came back lower.
So how many points is the difference, really?
The best-sourced number available is about 14 points — but it comes with four caveats you genuinely need, because without them the number is misleading.
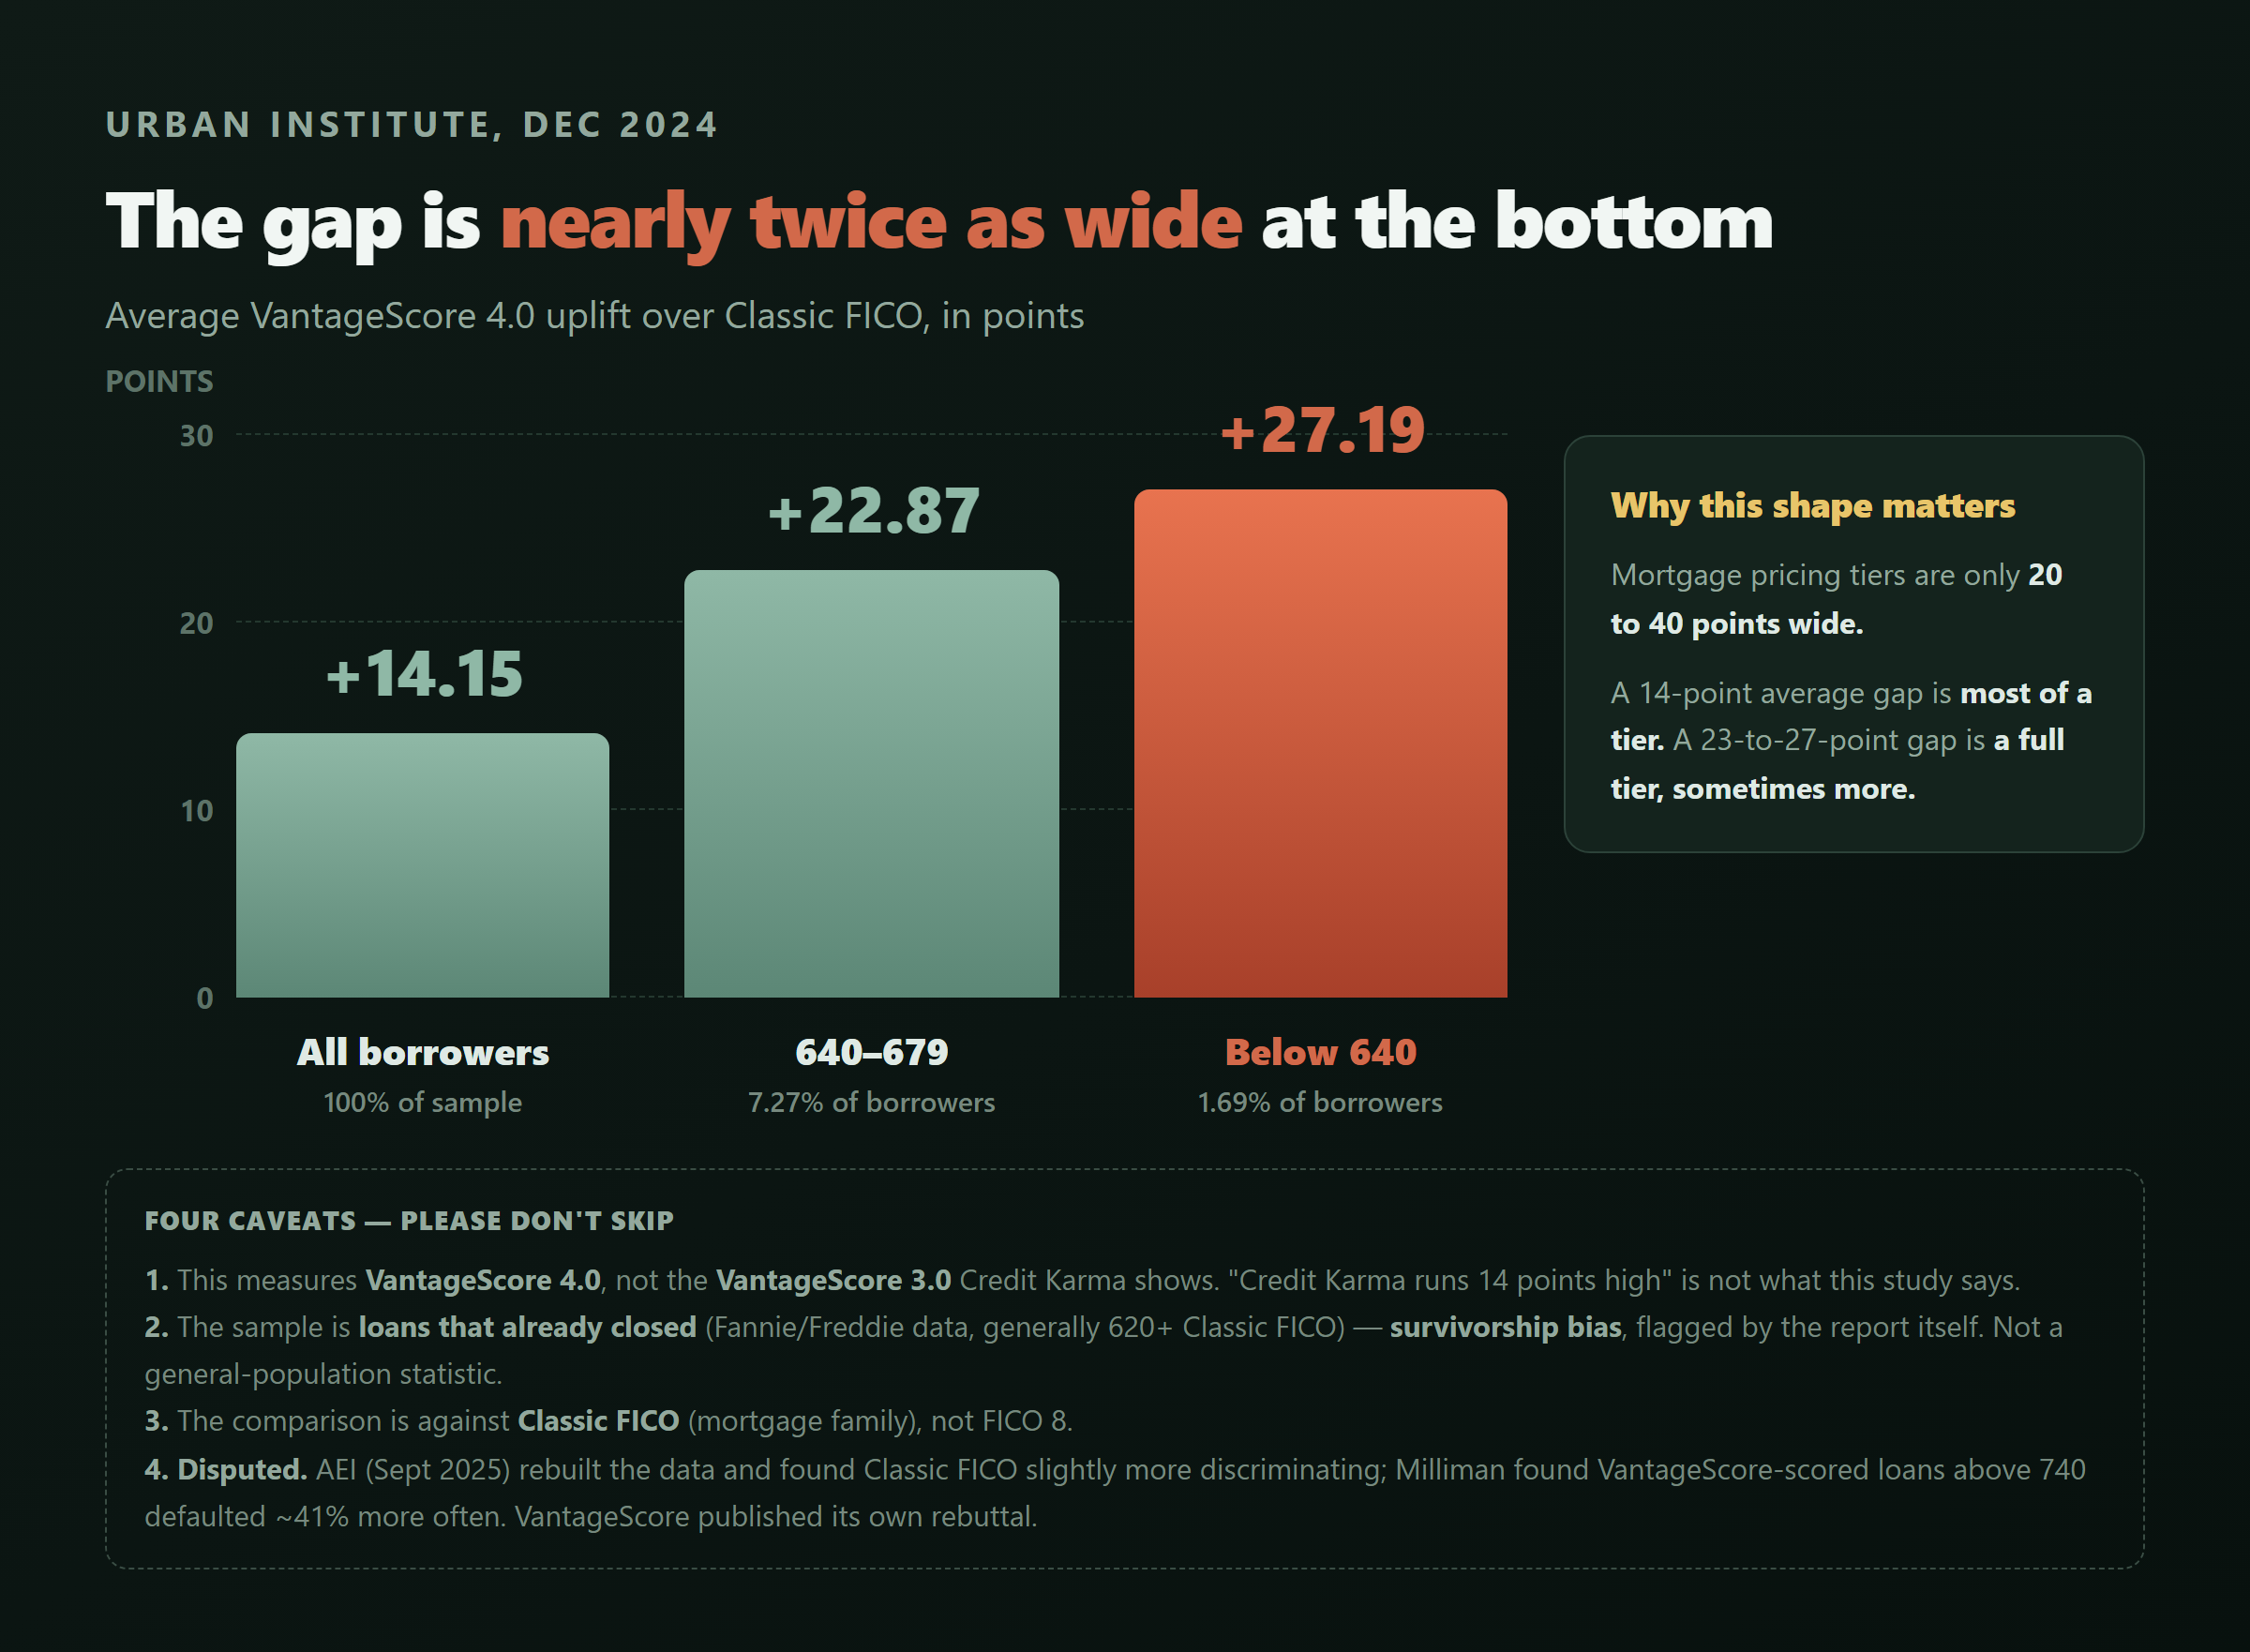
Here's the study. In December 2024, the Urban Institute — an independent nonprofit, not owned by FICO or VantageScore — published Classic FICO versus VantageScore 4.0, by Laurie Goodman and Jun Zhu. They merged Fannie Mae and Freddie Mac loan performance data with FHFA's historical VantageScore 4.0 dataset. Real loans. Real scores. Same borrowers, scored two ways.
What they found:
| Classic FICO band | Share of borrowers | Average VantageScore 4.0 uplift |
|---|---|---|
| Below 640 | 1.69% | +27.19 points |
| 640–679 | 7.27% | +22.87 points |
| All borrowers | 100% | +14.15 points |
Look at the shape of that. The gap is nearly twice as wide for people at the bottom of the range — exactly the people for whom a tier change costs the most.
Now the caveats. Please don't skip these.
1. It's not a Credit Karma number. The study compares VantageScore 4.0. Credit Karma shows VantageScore 3.0. Different generation of the model. Anyone telling you "Credit Karma runs exactly 14 points high" is inventing that.
2. The sample is people who already got approved. The public GSE dataset only contains loans that actually closed — generally borrowers above a 620 Classic FICO. The report flags this survivorship bias itself. This is not a general-population statistic.
3. It's compared against Classic FICO, not FICO 8. Classic FICO is the old mortgage family. If your credit card issuer is pulling FICO 8, this study doesn't measure your situation directly.
4. Other analysts dispute the interpretation. VantageScore itself published a rebuttal titled "Missing the Mark." AEI rebuilt the dataset in September 2025 and found Classic FICO slightly more discriminating (Gini 38.5% vs 37.0%; KS 28.9% vs 27.3%). Milliman, an actuarial firm, ran 4.07 million GSE loans and found VantageScore averaged 1.44% higher — and, more interestingly, that above 740, VantageScore-scored loans defaulted about 41% more often than Classic-FICO-scored loans at the same nominal number. Milliman's own conclusion is quotable: "Caution should be used when using Vantage directly in existing mortgage models…a calibration process is needed."
Translation: an 800 on one scale is not an 800 on the other. They're not just offset — they're shaped differently.
And one more thing about "national averages"
You'll see headlines noting the average VantageScore 4.0 was 702 in June 2026, while the average FICO Score was 714 in FICO's Spring 2026 report (down 2 points year over year, with a record 48.1% of consumers at 750+).
Do not read that as "VantageScore is stingier." Those two averages cover different populations. VantageScore scores tens of millions of thin-file consumers that FICO doesn't score at all — and those consumers skew low, pulling the average down. It's not the same set of people.
What does the score gap actually cost in real dollars?
Enough to matter. On a mortgage, the spread from the top tier to the bottom is $60,447 in interest. On a used car loan, it's more than 15 percentage points of APR.
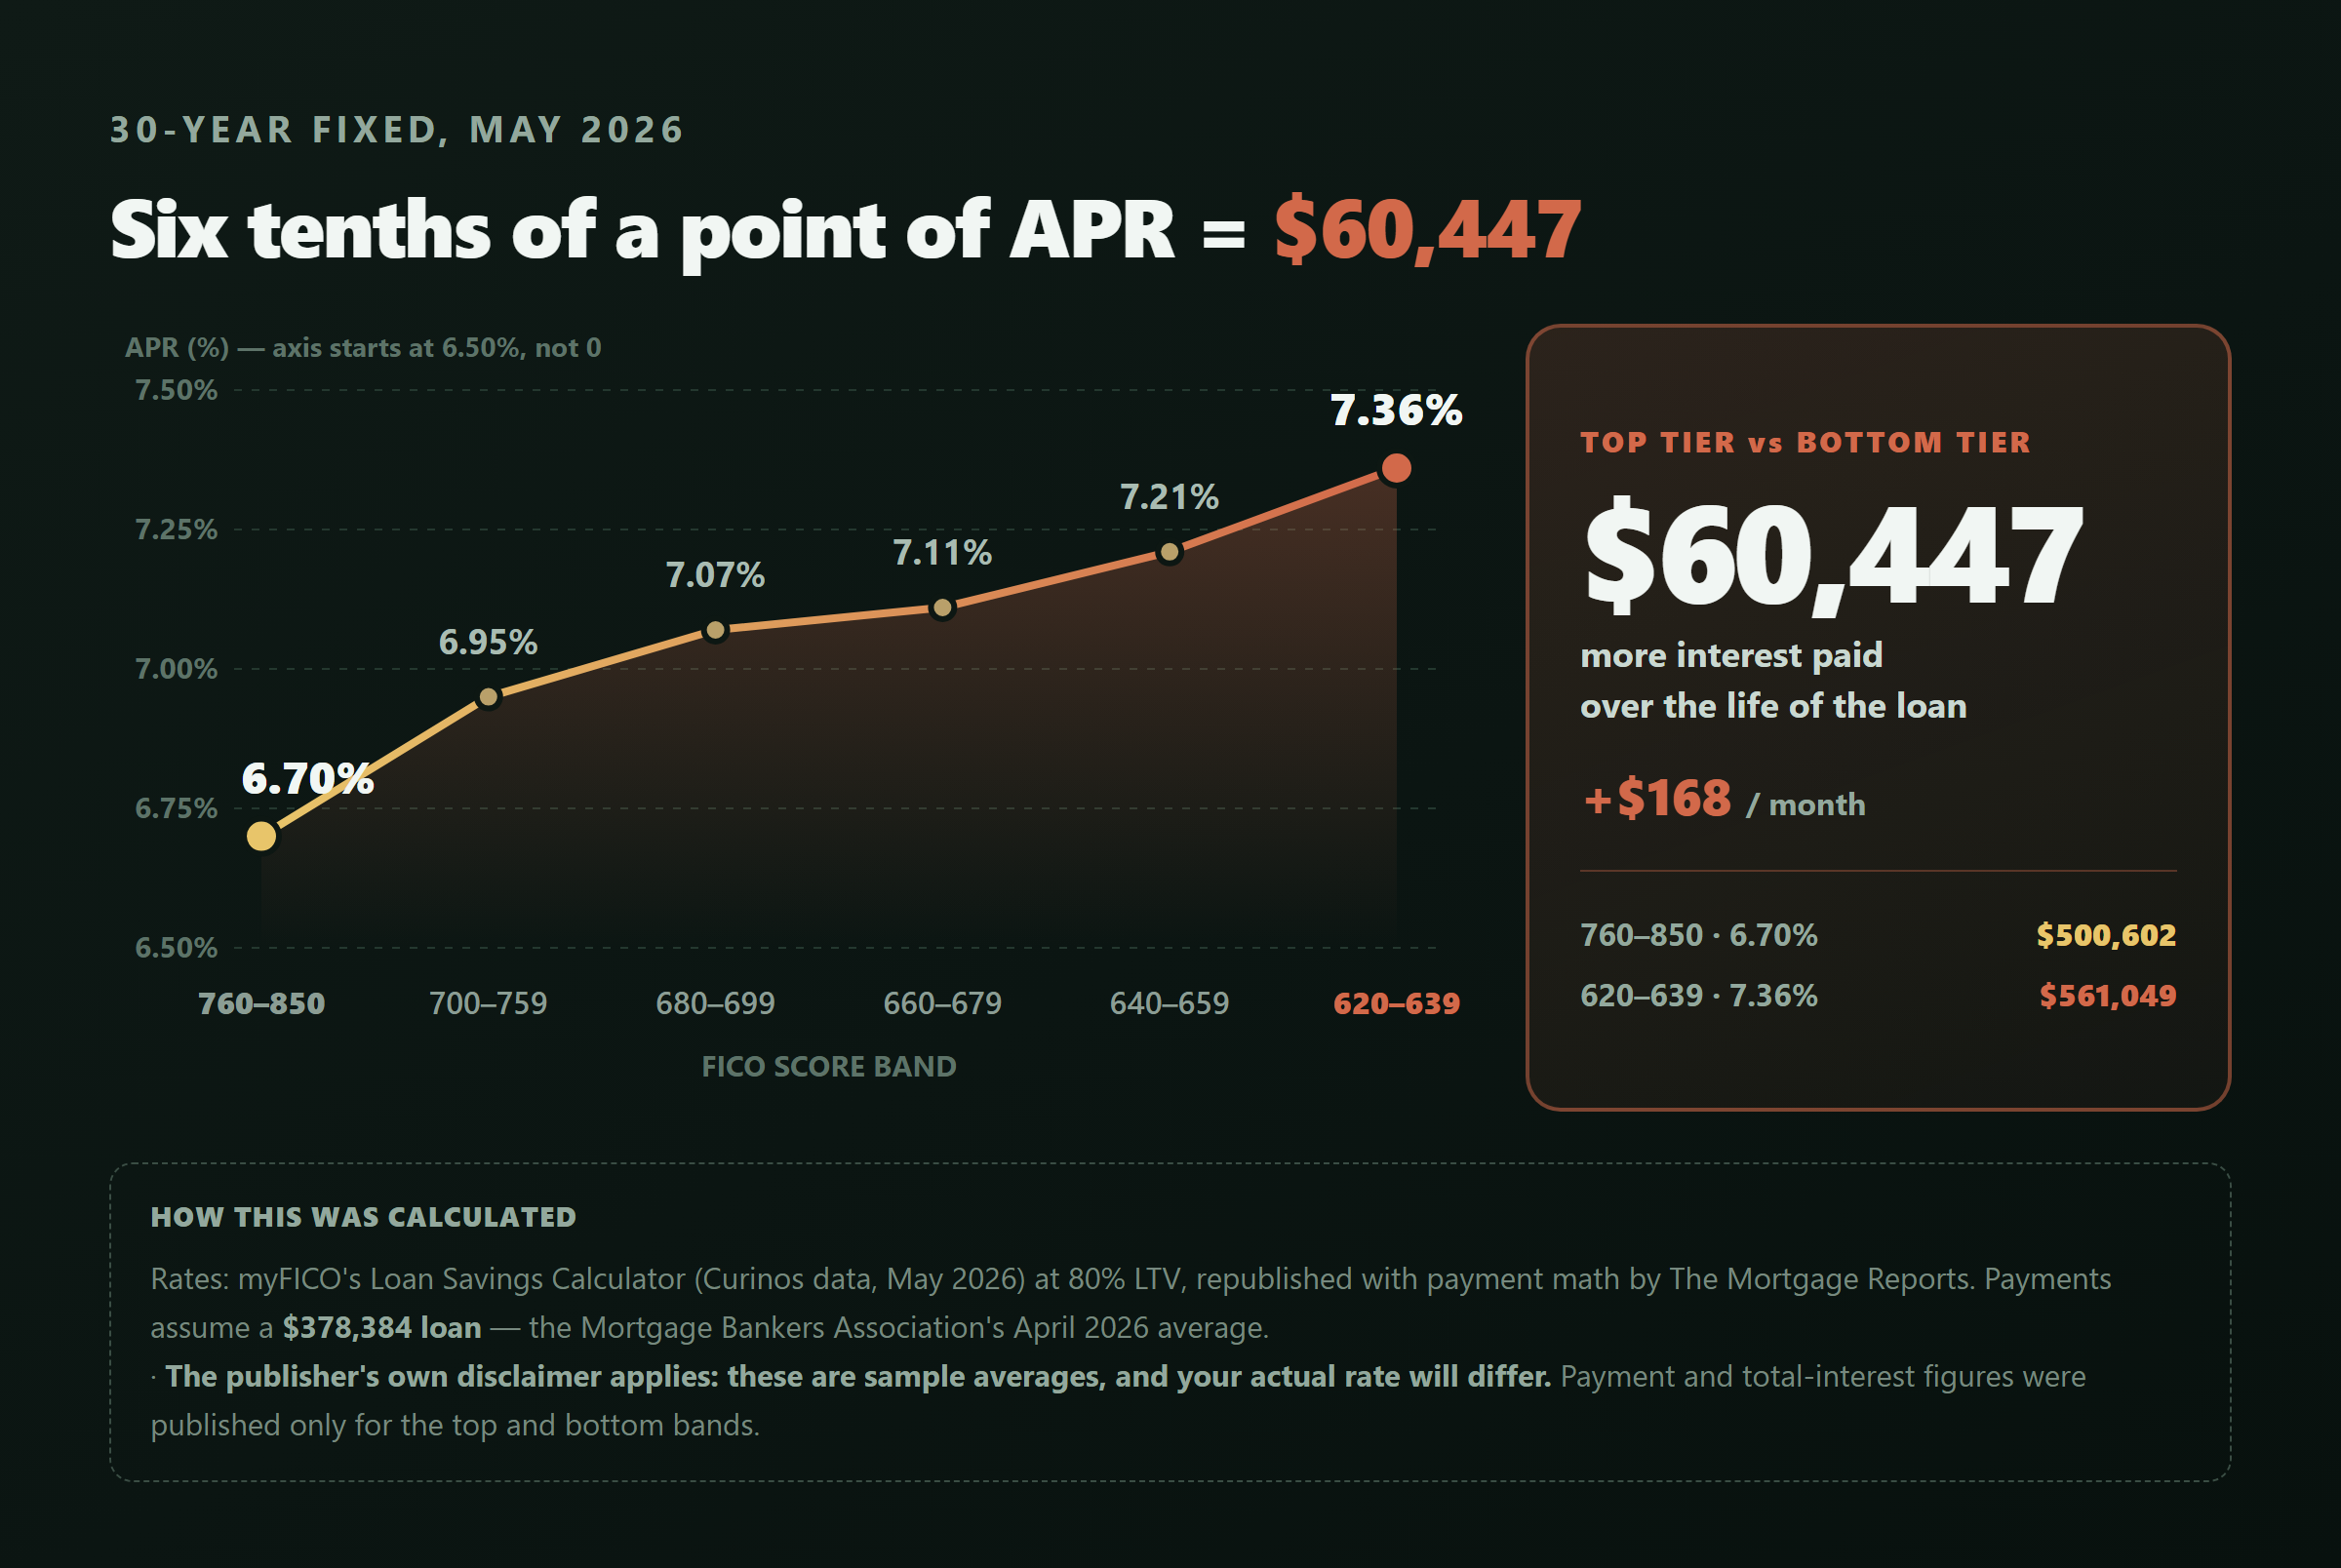
Here's the mortgage ladder (30-year fixed, May 2026 rate data from myFICO's Loan Savings Calculator via Curinos, at 80% LTV, republished with payment math by The Mortgage Reports):
| FICO Score | APR | Monthly payment | Total interest, 30 years |
|---|---|---|---|
| 760–850 | 6.70% | $2,442 | $500,602 |
| 700–759 | 6.95% | — | — |
| 680–699 | 7.07% | — | — |
| 660–679 | 7.11% | — | — |
| 640–659 | 7.21% | — | — |
| 620–639 | 7.36% | $2,610 | $561,049 |
Payments assume a $378,384 loan — the Mortgage Bankers Association's April 2026 average. Top to bottom: $168 a month, $60,447 over the life of the loan.
Note: the publisher's own disclaimer applies — these are sample averages, and your actual rate will differ.
Here's the arithmetic that should make you sit up
Look at the width of those bands. They're 20 to 40 points wide.
A 14-point average model gap is most of a tier. A 23-to-27-point gap — which is what people in the 640–679 range showed in the Urban data — is a full tier, sometimes more.
Slip from 700–759 into 680–699 and you pick up 0.12 percentage points. Slip from 660–679 into 620–639 and you pick up 0.25.
The gap between the app score and the real score is roughly the width of one pricing tier. That's not a coincidence you can shrug off. That's the whole ballgame.
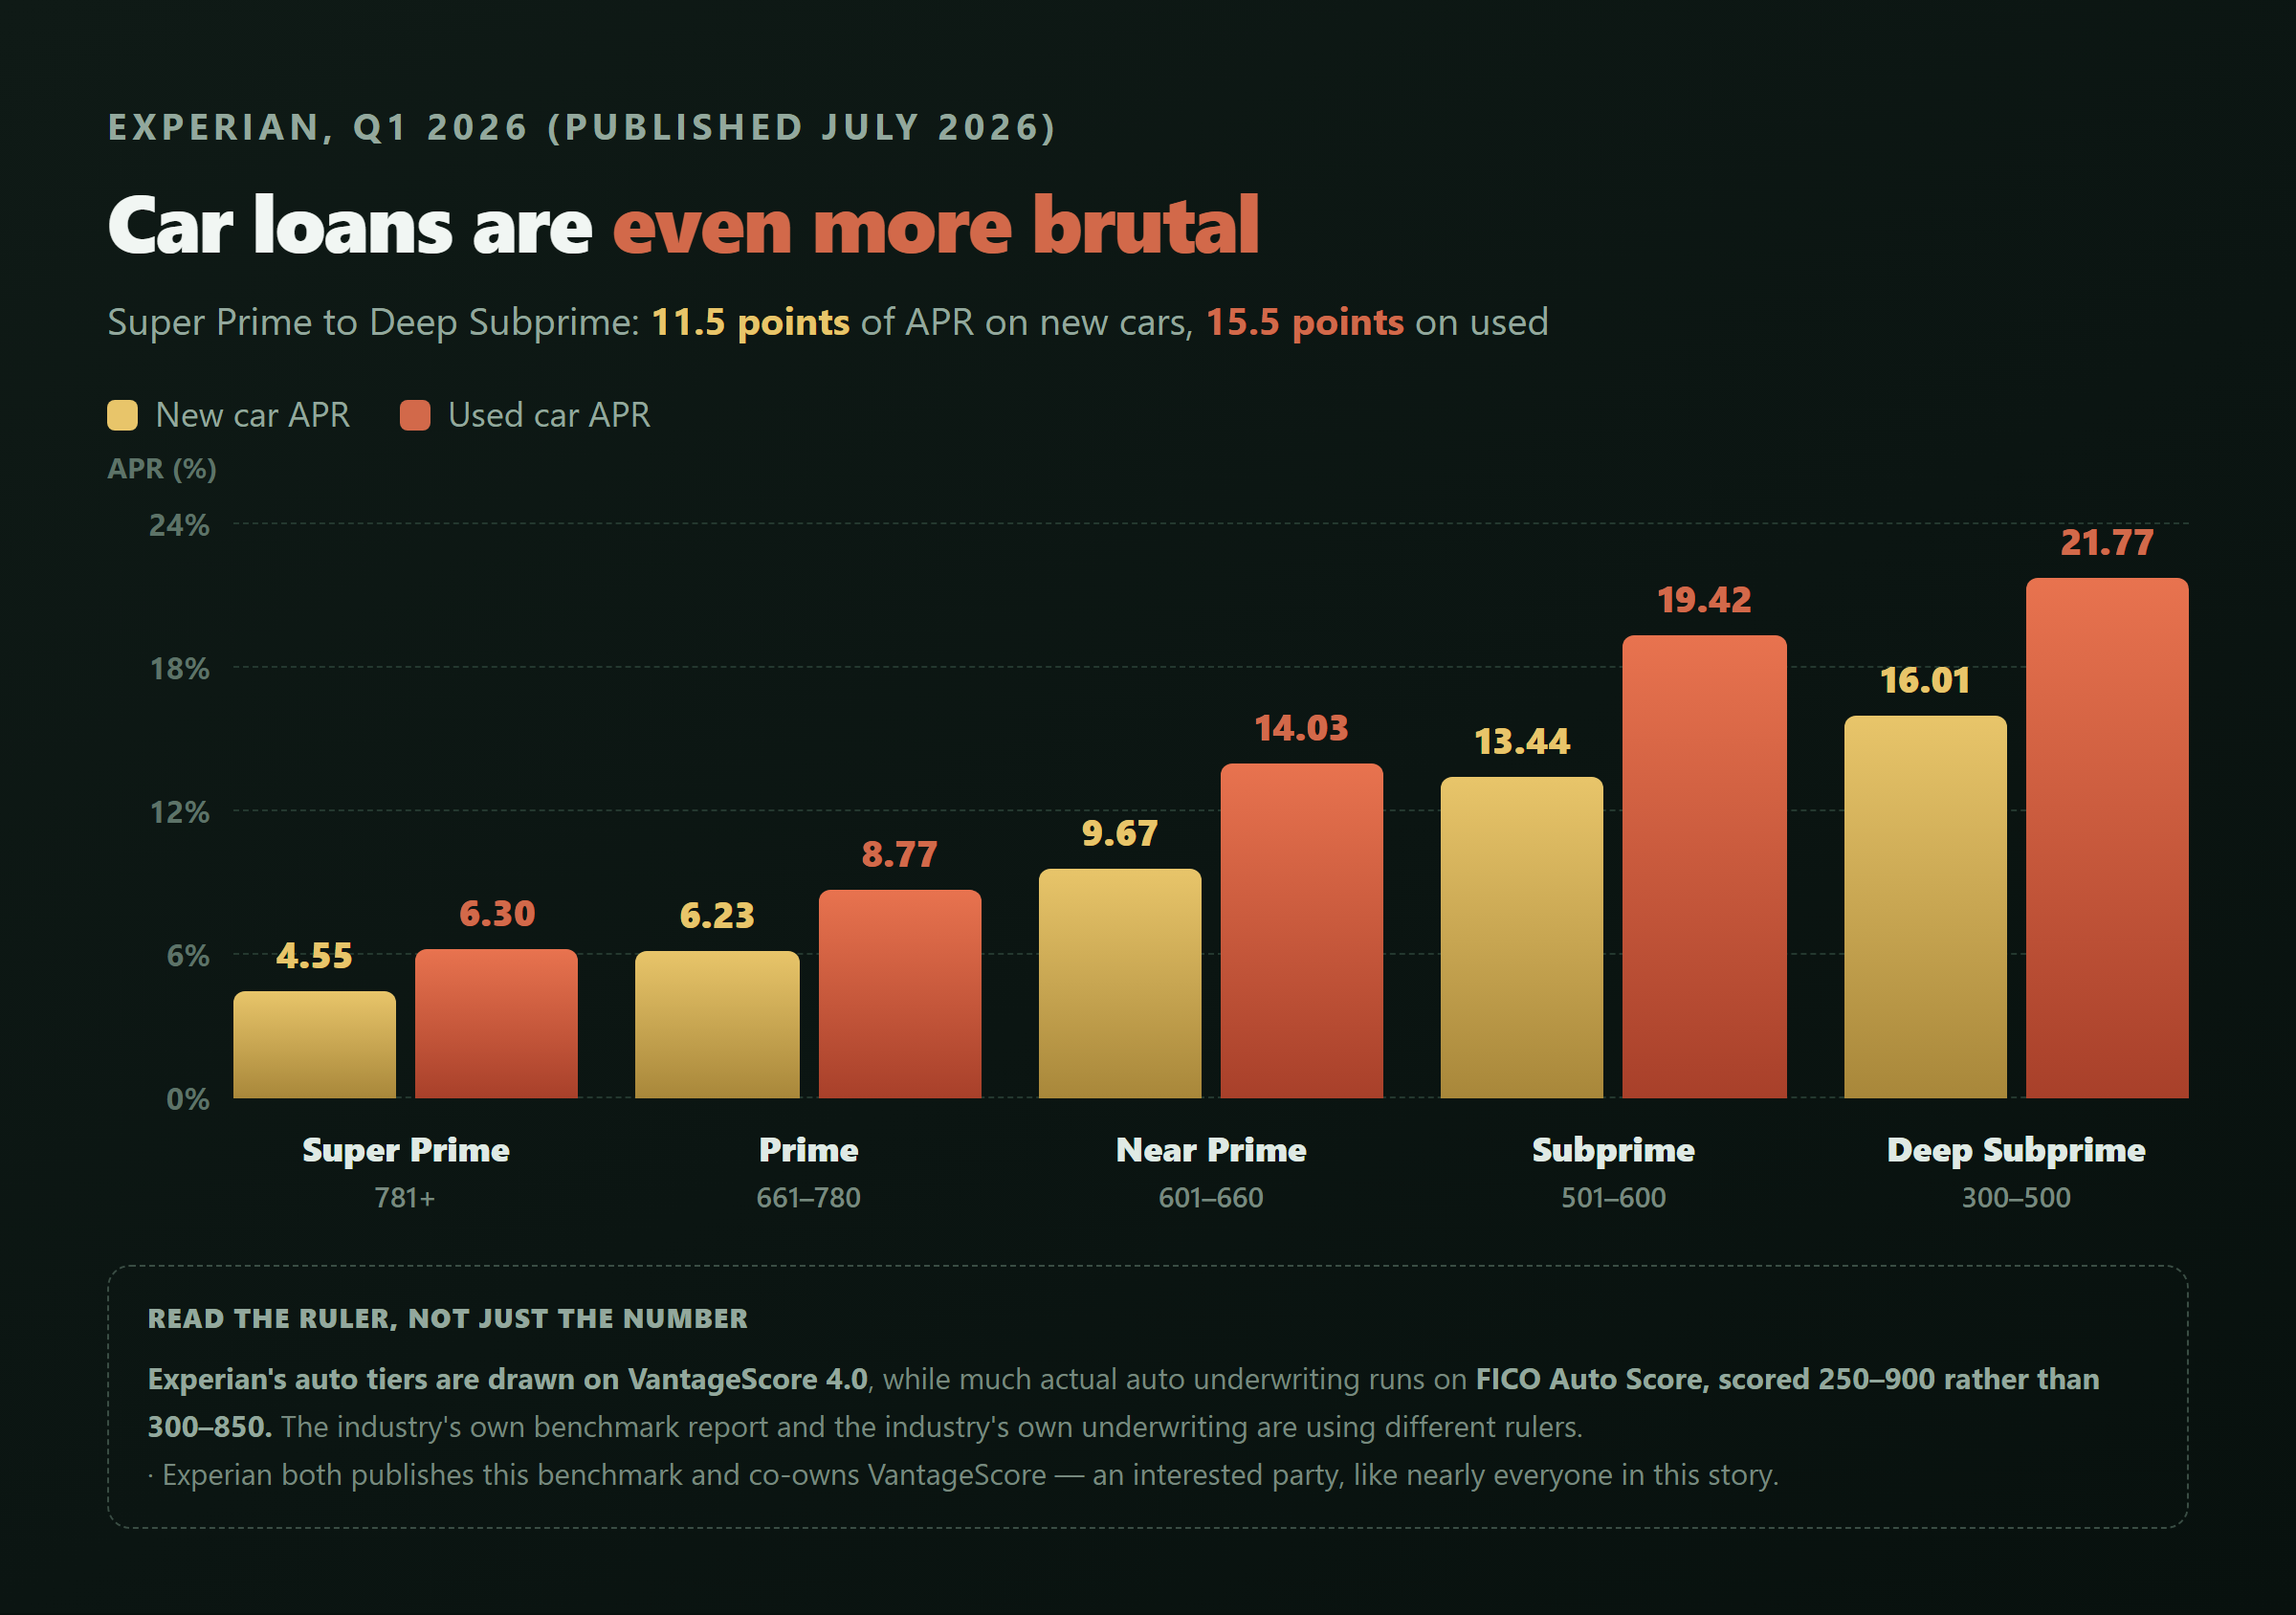
Car loans are even more brutal
Experian's Q1 2026 auto finance data (published July 2026):
| Tier | Score range | New car APR | Used car APR |
|---|---|---|---|
| Super Prime | 781+ | 4.55% | 6.30% |
| Prime | 661–780 | 6.23% | 8.77% |
| Near Prime | 601–660 | 9.67% | 14.03% |
| Subprime | 501–600 | 13.44% | 19.42% |
| Deep Subprime | 300–500 | 16.01% | 21.77% |
That's an 11-plus point spread on new cars and about 15.5 points on used ones.
And now the part that's almost too perfect: Experian's auto tiers are drawn on VantageScore 4.0, while a lot of actual auto underwriting runs on FICO Auto Score, which is scored on a 250–900 scale rather than 300–850.
The industry's own benchmark report and the industry's own underwriting are using different rulers. If the industry can't keep it straight, you can stop feeling bad about being confused.
Which credit score do lenders actually use in 2026?
Mostly FICO — but the famous "90% of top lenders" statistic is FICO's own marketing claim, and FICO has never published the methodology behind it.
I went looking for the source. Here's what's actually there.
The line appears at least four times on myFICO's credit education page ("90% of top lenders use FICO® Scores") and again on FICO's consumer site ficoscore.com. In every instance: no footnote, no survey cited, no year of data, and no definition of what counts as a "top lender." FICO tells media to email its press office for survey methodology — meaning it isn't published openly.
Searching for independent or regulatory confirmation of the 90% figure turns up nothing but FICO's own pages and third parties repeating FICO's number.
That doesn't make it false. It makes it an unaudited claim from the company that sells the product. Worth knowing before you quote it at a dinner party.
The counterweight comes from an equally interested party. VantageScore — which is owned by the three credit bureaus — says its scores were used 41.7 billion times in 2024, up 55% year over year, by more than 3,700 institutions including nine of the top 10 U.S. banks.
Forty-two billion versus "90% of lending." How can both be true?
Here's the reconciliation, and it's in VantageScore's own numbers: nearly nine billion of those uses came from "consumer websites, which include credit education and credit score display apps and websites."
In other words, a huge chunk of VantageScore's usage is showing you your score in an app — not deciding your loan. One model dominates underwriting. The other dominates the screens you actually look at. Both statements are true at once, which is precisely why the confusion persists.
What changed in 2025–2026 (this part is new)
The mortgage market officially became a two-score market.
- July 8, 2025 — FHFA Director Bill Pulte announced Fannie Mae and Freddie Mac would begin accepting VantageScore 4.0 for mortgage underwriting, effective immediately. VantageScore 4.0 folds in rental, utility and telecom payment data.
- The tri-merge stayed. FHFA reversed its earlier plan to move to a two-bureau "bi-merge" requirement.
- By May 2026, large lenders including United Wholesale Mortgage and NewRez were publicly describing positive experience with VantageScore 4.0, citing better pricing and expanded eligibility.
- FICO 10T is queued up next. Fannie and Freddie published historical FICO 10T scores on July 1, 2026, and HUD has signaled 10T for FHA.
What this means for you in practice: two applicants with identical files can now be scored on two different models at two different lenders — and the lender picks the model, not you. "Which score do lenders use?" is a harder question in 2026 than it was in 2024.
Wait — there's more than one FICO score too?
Yes. Quite a few. And the mortgage ones are decades old.
This is the fact that makes the whole mess finally click. "FICO score" isn't one number either.
| What it's used for | Experian | TransUnion | Equifax | Scale |
|---|---|---|---|---|
| Conforming mortgage ("Classic FICO") | FICO Score 2 | FICO Score 4 | FICO Score 5 | 300–850 |
| General lending (most common) | FICO 8 | FICO 8 | FICO 8 | 300–850 |
| Auto lending | FICO Auto 2 | FICO Auto 5 | FICO Auto 4 | 250–900 |
| Credit cards | FICO Bankcard 2 / Score 3 | FICO Bankcard 4 | FICO Bankcard 5 | 250–900 |
Read that last column twice. Industry-specific FICO models run 250–900, not 300–850. A 780 from an auto lender is not sitting on the same ruler as the 780 in your app.
FICO Score 9 has been in lender use since 2014, and FICO 10 and 10T arrived in January 2020, with 10T adding "trended data" — patterns over time instead of a single snapshot.
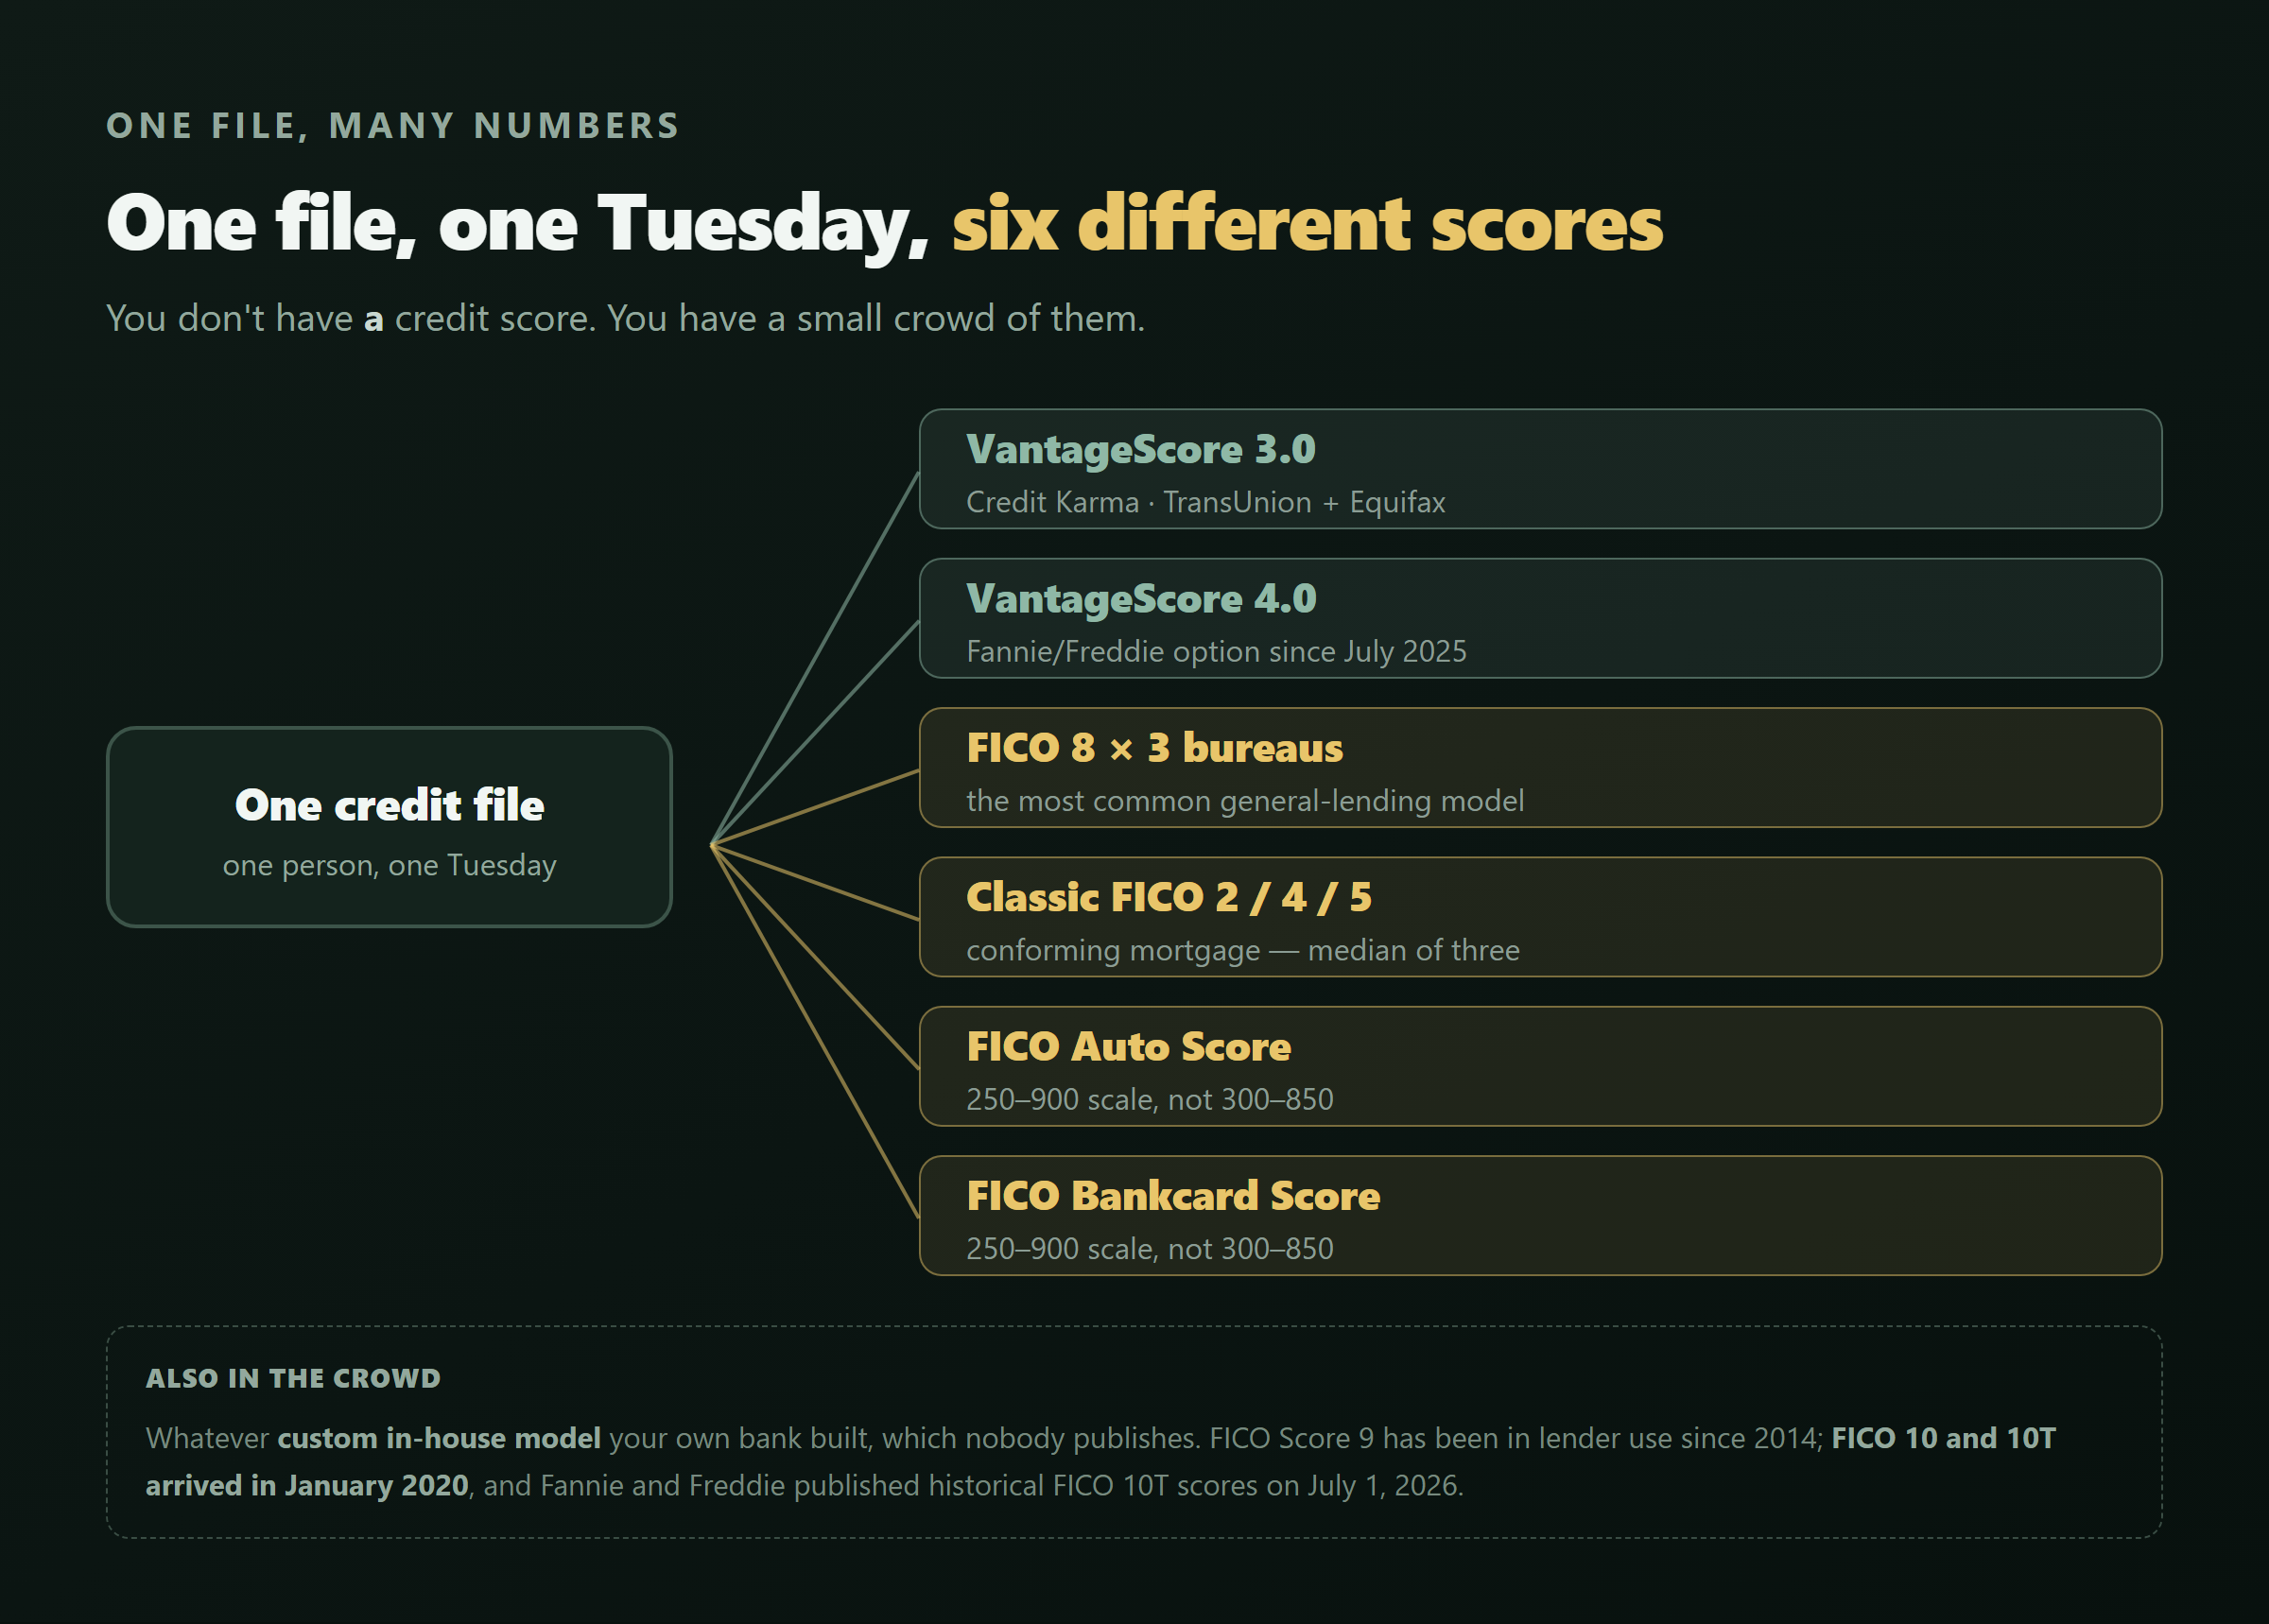
So on any given Tuesday, one person with one credit file legitimately has: a VantageScore 3.0, a VantageScore 4.0, a FICO 8 at each of three bureaus, a Classic FICO at each of three bureaus, a FICO Auto Score, a FICO Bankcard Score, and whatever custom model their own bank built in-house.
You don't have a credit score. You have a small crowd of them.
What is a good credit score, and what are the credit score ranges?
Short answer: "Good" starts at 670 if the number in front of you is a FICO Score. It starts at 661 if it's a VantageScore. Same word, two different lines drawn on the same 300–850 scale.
Here's FICO's own official breakdown, from myFICO's consumer education page:
| FICO tier | Score range |
|---|---|
| Poor | 300–579 |
| Fair | 580–669 |
| Good | 670–739 |
| Very Good | 740–799 |
| Exceptional | 800–850 |
(Source: myFICO, "What is a Credit Score?" — myfico.com/credit-education/credit-scores. Experian's own breakdown, published December 2024, lists identical numbers.)
And here's VantageScore's — same 300–850 scale, sliced differently:
| VantageScore 3.0 tier | Range | Share of consumers |
|---|---|---|
| Subprime (Poor) | 300–600 | 18% |
| Near Prime (Fair) | 601–660 | 17% |
| Prime (Good) | 661–780 | 33% |
| Super Prime (Excellent) | 781–850 | 31% |
(Source: Experian, "What Are the Different Credit Score Ranges?", Dec 18, 2024, citing VantageScore's published tiers.)
VantageScore 4.0 keeps the exact same 601 / 660 / 780 / 850 boundaries — it just splits the bottom into "Very Poor" (300–499) and "Poor" (500–600) instead of one combined "Subprime" tier. That's a version update between two VantageScore products, not a disagreement.
The nine points that flip your grade
Put the two "Good" thresholds side by side:
- FICO: Good begins at 670.
- VantageScore: Good (Prime) begins at 661.
A score of 661 through 669 falls in the gap between them. VantageScore calls that "Good." FICO calls it "Fair" — one tier down. Same person, same file, same week, two different verdicts. Neither company is wrong; they simply didn't agree on where the line goes.
For a sense of how far apart the same file can land in the real world — not just at this one boundary — a comparison cited by Self.inc walked through a real consumer file that came back 623 on VantageScore and 721 on FICO: bordering Fair/Poor on one scale, solidly Good on the other, from the same underlying credit history.
And the scale itself isn't even always 300–850
You saw this above with FICO Auto and FICO Bankcard Scores: those run on a 250–900 scale, not 300–850. The Good/Fair/Very Good table above doesn't apply to them at all — myFICO's own consumer education page, where that table lives, doesn't publish a graded breakdown for the 250–900 scale. If an auto lender hands you a number in the 700s, check which scale it's on before you assume what tier it means.
What makes the two models disagree on the same file?
They follow different rules about what counts. Here are the ones that change your number the most.
| Rule | FICO | VantageScore 4.0 |
|---|---|---|
| Minimum history to be scored at all | 6 months (plus a recently reported account) | 1 month |
| Rate-shopping window (multiple applications treated as one) | ~45 days for mortgage, auto and student loans | ~14 days, applied to all inquiry types |
| Unpaid medical collections | Newer FICO models weight them less than other collections | Excluded entirely |
| Paid collections | Older FICO versions still count them | Ignored in VantageScore 3.0 and 4.0 |
| Rent, utility, telecom payments | Not in Classic FICO; FICO 10T uses trended credit data | Included where reported |
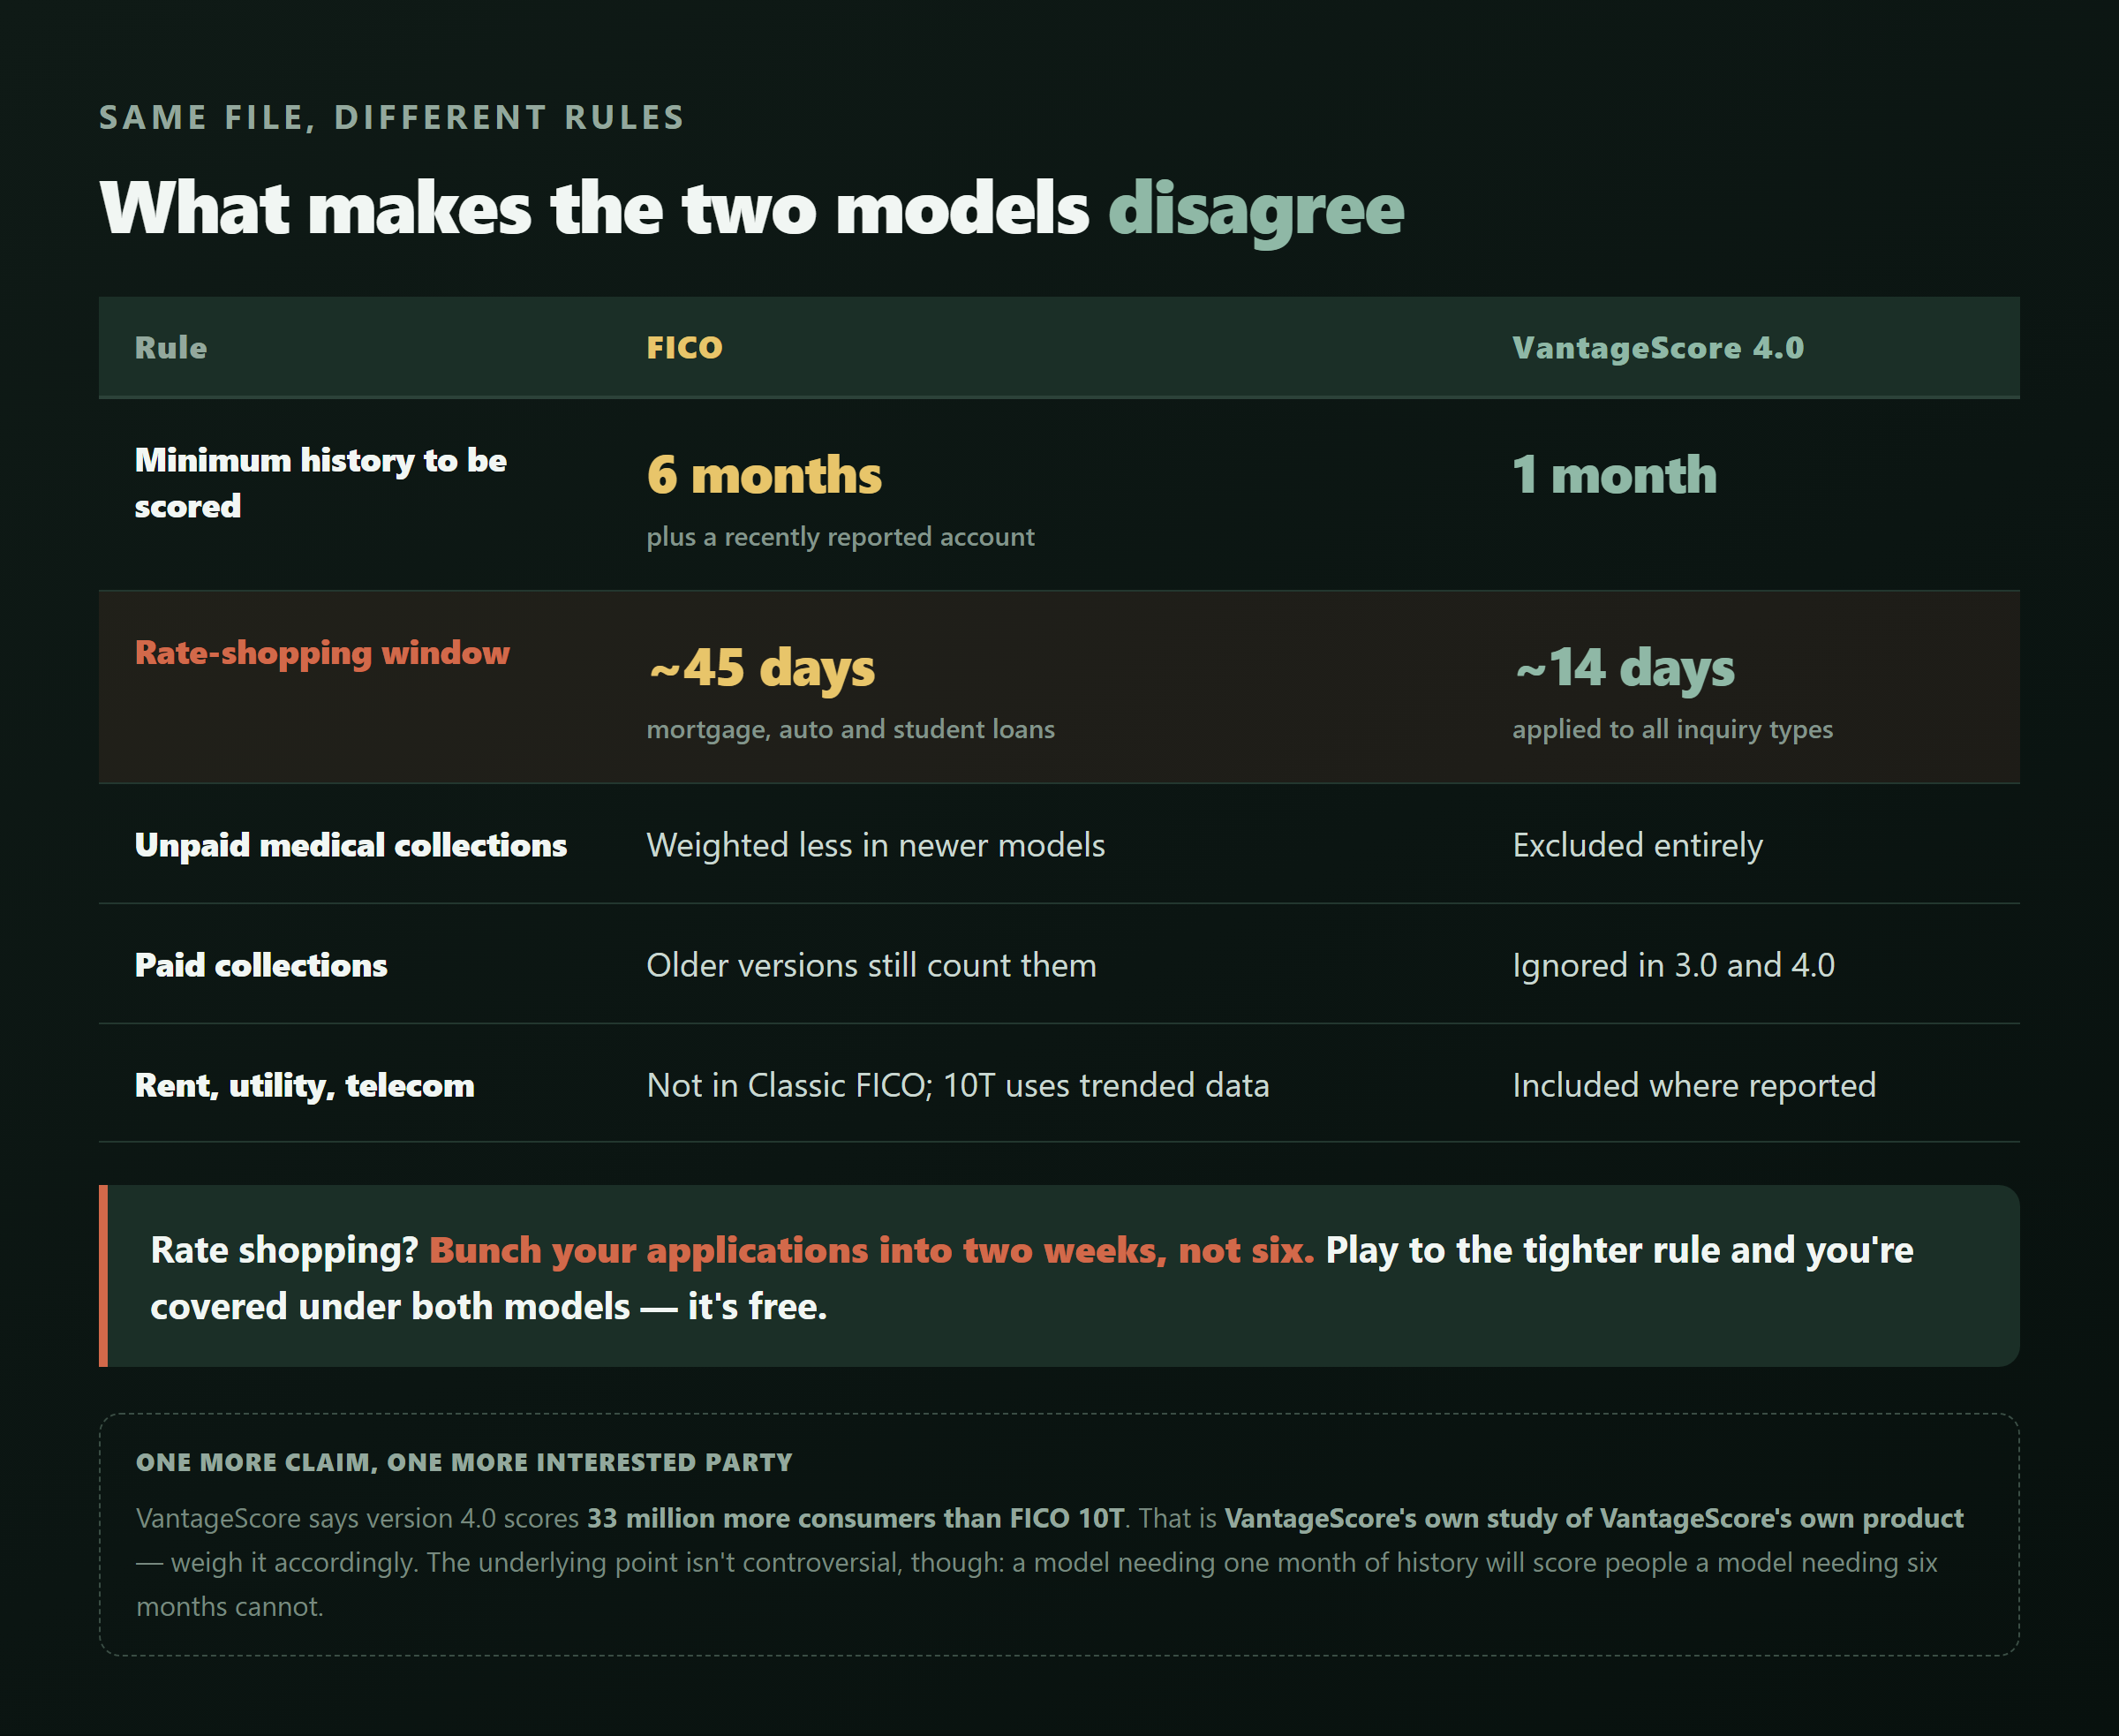
The rate-shopping row is the one that can actually cost you this month. Shop three mortgage lenders over three weeks: FICO treats that as roughly one inquiry. VantageScore may count the later ones separately.
So if you're rate shopping, bunch your applications together. Two weeks, not six. That single habit is free and it protects you under both models.
VantageScore also says version 4.0 scores 33 million more consumers than FICO 10T, including nearly 10 million with scores above 620 who are invisible to FICO 10T. That's VantageScore's own study of VantageScore's own product, so weigh it accordingly — but the underlying point isn't controversial: a model that needs one month of history will score people a model needing six months can't.
Why is the free app so eager for you to feel approved?
Because you aren't the customer. The lender is.
This isn't a conspiracy theory — it's in the audited financials. Credit Karma is owned by Intuit. In Intuit's fiscal 2025 reporting, the Credit Karma segment's revenue rose $555 million, or 32%, year over year. The growth came from personal loans (+$221 million), credit cards (+$213 million) and auto insurance (+$99 million). Segment operating income rose $421 million, or 102%. In Q4 FY2025 alone, Credit Karma brought in $649 million, up 34%.
The free score is the funnel. The loan and card referrals are the product.
That's not an accusation of wrongdoing. It's the disclosed business structure — and it explains why the interface is built to make you feel eligible and tap "see my offers."
The FTC already ruled on one version of this
Between 2018 and 2021, the FTC alleged, Credit Karma told consumers they were "pre-approved" or had "90% odds" of approval for cards and loans. Many were then denied — wasting their time and, worse, generating hard inquiries that lowered their scores.
The settlement: $3 million, covering 497,425 consumers. The FTC sent out more than $2.5 million in checks and PayPal payments starting in October 2024, and later Zelle payments to people who never cashed the checks.
Nearly half a million people. So if you've ever thought "the app told me I'd get it and the lender said no" — that's not you being careless. It's a documented, federally-adjudicated pattern.
And there's a delicious structural irony worth naming: search "why is my credit score different" and some of the highest-ranking explanations are published by the very companies whose free-score apps created the confusion. Everyone explaining this to you is selling something.
Where can I see my real FICO score for free?
Several banks will show you a genuine FICO 8 for free — but no app can show you the exact score a specific lender will pull. Here's the honest map.
Free, and it's actually FICO:
- Discover Credit Scorecard — FICO Score 8 based on TransUnion data. Open to non-customers.
- Capital One CreditWise — completed a switch from VantageScore 3.0 to FICO Score 8 (TransUnion) as of summer 2025. This changed recently, so confirm it's still current when you sign up.
- American Express MyCredit Guide — free FICO Score plus an Experian report.
- Experian — free FICO Score with a free membership.
Free, but it's a VantageScore (know what you're looking at):
- Credit Karma — VantageScore 3.0, TransUnion and Equifax.
- Chase Credit Journey — VantageScore 3.0 from TransUnion. Which is a genuinely strange one: Chase shows you a VantageScore while Chase itself underwrites on FICO.
Free reports, no scores:
- AnnualCreditReport.com — the actual credit reports from all three bureaus, and as of 2026 you can pull them every seven days. No scores included. Still worth doing, because errors on the report move every score you have.
Paid:
- myFICO sells FICO scores across multiple versions, including the mortgage 2/4/5 set.
The one guaranteed way — and yes, it's a little grim
Under the Fair Credit Reporting Act as amended by Dodd-Frank, a lender that denies you credit must send an adverse action notice, and a lender that approves you on worse terms based on your credit report must send a risk-based pricing notice. Both are legally required to disclose the credit score they actually used and how it was determined. Some lenders satisfy the rule by sending a credit score disclosure notice to every applicant regardless of outcome.
So the only free, guaranteed way to learn the exact score a specific lender ran on you is to apply and read the notice they're required to mail you.
No app can give you that in advance. Not one.
Honestly, here's the part nobody can fix
I'd rather tell you the limits than pretend this article solves everything.
1. Nobody can tell you your gap in advance. The last time a regulator measured this at scale was the CFPB's 2012 study, ordered by Congress under Dodd-Frank. It pulled 200,000 credit files from each of the three bureaus — 600,000 total. Different scoring models placed consumers in the same credit-quality category 73–80% of the time, one category off 19–24% of the time, and two or more categories off 1–3% of the time. Correlations between models were high, generally over .90.
The CFPB's own headline: "one out of five consumers would likely receive a meaningfully different score than would a creditor." And then-Director Richard Cordray's line, which has aged remarkably well: "When consumers buy a credit score, they should be aware that a lender may be using a very different score in making a credit decision."
The report's own conclusion is the honest one: "No consumer will know in advance whether the score he or she sees will vary significantly from the score a creditor sees."
One caveat on that study: it's from 2012. It predates VantageScore 3.0 and 4.0 entirely — the version it examined ran on a 501–990 scale. Treat it as "the last time anyone with subpoena power measured this," not as a description of today's models.
2. The point gaps everyone quotes online are mostly made up. You'll see "Credit Karma runs 20 to 50 points high" repeated constantly. I traced it. It leads to mortgage-broker and credit-repair marketing blogs, never to a study. Same with the widely-shared story of a homebuyer whose 720 became a 680 and cost $150 a month. No underlying data. I left both out on purpose.
3. Everyone in this story has a stake. FICO sells FICO. VantageScore is owned by the bureaus. Credit Karma earns from lender referrals. Experian publishes the auto benchmark and co-owns VantageScore. The only genuinely disinterested sources here are the CFPB, the FTC, and independent analysts like Urban, AEI and Milliman — and even those three disagree with each other.
Frequently asked questions
Q. Why is my Credit Karma score higher than my actual score?
A. Credit Karma shows VantageScore 3.0 from TransUnion and Equifax. Most lenders underwrite on some version of FICO, pulled from all three bureaus. They're different models with different rules, so they produce different numbers on the same file.
Q. Which credit score do lenders actually use?
A. Most lending still runs on FICO, though the widely-quoted "90% of top lenders" figure is FICO's own unpublished marketing claim. Since July 2025, mortgage lenders may also choose VantageScore 4.0 for Fannie and Freddie loans — so the lender picks the model.
Q. How many points is the difference between VantageScore and FICO?
A. The best-sourced figure is the Urban Institute's December 2024 finding of 14.15 points on average — VantageScore 4.0 higher than Classic FICO — rising to 22.87 points in the 640–679 band and 27.19 points below 640. That's a mortgage-borrower sample comparing VantageScore 4.0, not the 3.0 your app shows.
Q. What is a good credit score?
A. It depends which model is doing the grading. FICO's official tiers put "Good" at 670–739 (Poor 300–579, Fair 580–669, Very Good 740–799, Exceptional 800–850). VantageScore draws the line lower — its "Good" (Prime) tier starts at 661. A score of 661–669 is graded "Good" by VantageScore and "Fair" by FICO.
Q. What are the credit score ranges?
A. FICO: Poor 300–579, Fair 580–669, Good 670–739, Very Good 740–799, Exceptional 800–850. VantageScore 3.0: Subprime 300–600, Near Prime 601–660, Prime (Good) 661–780, Super Prime 781–850. VantageScore 4.0 uses the same 601/660/780/850 boundaries but splits the bottom tier into Very Poor (300–499) and Poor (500–600). Industry-specific FICO scores like FICO Auto and FICO Bankcard use a different 250–900 scale entirely.
Q. Does checking my own credit score lower it?
A. No. Checking your own score is a soft inquiry and doesn't affect it. What hurt the consumers in the FTC's Credit Karma case was applying for products they were told they'd get — those applications triggered hard inquiries.
Q. Where can I see my real FICO score for free?
A. Discover Credit Scorecard (open to non-customers), Capital One CreditWise, American Express MyCredit Guide and Experian all offer a free FICO Score. Chase Credit Journey shows a VantageScore, not a FICO.
Q. Does a higher VantageScore mean I'm actually lower risk?
A. Not necessarily at the same number. Milliman found that above 740, loans scored by VantageScore defaulted about 41% more often than loans at the same nominal Classic FICO. The scales aren't interchangeable.
Q. Should I stop using free credit score apps?
A. No — they're genuinely useful for spotting new accounts, errors and sudden drops. Just treat the number as a direction indicator, not a decision-grade figure.
One thing to do before your next application
You don't need to sign up for six monitoring services or buy a score package.
Do this instead: before your next big application, pull your free reports from AnnualCreditReport.com and fix the errors. Not the score — the report. Every score you have, FICO and VantageScore alike, is built on top of that same underlying file. An account that isn't yours, or a paid collection still showing as unpaid, drags down every number in the crowd at once.
Then, if you're rate shopping, keep your applications inside a two-week window. FICO gives you 45 days. VantageScore gives you about 14. Play to the tighter rule and you're covered either way.
And when a lender does pull your file — read the notice they send. It's the only place the real number lives.
Have you run into this yourself? I'd love to know which way it broke for you:
- My app score was higher than what the lender pulled
- My app score was lower — pleasant surprise
- They were close enough that it didn't matter
- I've never compared them
Tell me in the comments — number one seems to be the common story, but I'd like to know if that holds up.
Sources: Urban Institute (Dec 2024); AEI (Sept 2025); Milliman (Sept 2024); CFPB (2012); FTC (2022–2024); Intuit SEC filings (Aug 2025); FHFA (2025–2026); Experian (2026); The Mortgage Reports / myFICO-Curinos (May 2026); myFICO credit-education page (credit score ranges); Experian (Dec 2024, credit score ranges); Self.inc (VantageScore vs. FICO range comparison). Rate figures are published averages and are for illustration only — your actual rate will differ.


Comments
Post a Comment