Does Unplugging Really Save Money? Why 5% and 23% Differ
Two numbers run every article about vampire power.
One says 5 to 10 percent of your bill.
The other says 23 percent.
Last updated: 28 August 2026 · Figures and rules in this post are current as of this date.
They get presented as a fight, as if somebody must be wrong. Nobody is wrong. They are counting different things, in different places, with different instruments, in different years.
We downloaded the report behind the 23 percent — all 36 pages of it — and pulled the caveats out of the appendices, where they live. We pulled the wording of the 5 to 10 percent claim from the national lab that made it, rather than from a blog quoting a blog. Then we redid the arithmetic at today's electricity price.
Here is what the standby power numbers actually measure, and what a plug you can physically pull is worth.
Figures current as of August 28, 2026. Electricity price is EIA's June 2026 residential average. The NRDC study is dated 2015 and its core data is from 2010–2011; we say so every time we use it.
What do "5%" and "23%" actually measure?
One measures leakage from switched-off devices. The other measures everything your house is drawing at 3 a.m. — including things left fully on.
The 5 to 10 percent figure belongs to the Lawrence Berkeley National Laboratory's Standby Power project. Their own FAQ answers the question this way, word for word:
"Nobody knows for sure, but it's typically 5-10% of residential electricity use in most developed countries and a rising fraction in the developing countries (especially in the cities)."
Source: Lawrence Berkeley National Laboratory, Standby Power FAQ, retrieved 2026-08-28 — the national lab that produced the estimate
https://standby.lbl.gov/frequently-asked-questions
That opening clause — nobody knows for sure — never survives into the articles that cite it. LBNL also concedes its own definition of standby power ("electricity consumed by devices when they are switched off or not performing their primary functions") "lacks technical specificity." Their example: displaying the time is a primary function on an alarm clock, but not on a microwave.
The 23 percent belongs to NRDC, and it is a different measurement entirely. NRDC defines home idle load as the total power a home draws — "whether in off/standby, sleep, or on mode" — at the hour in the month when the house is quietest, read from smart meter data.
Read that again: or on mode. A device that is switched on and running counts.
In NRDC's own home audits, the single largest idle load in one house was a hot water recirculation pump drawing up to 92 watts around the clock. The second largest was a 90-watt halogen light fixture the resident had left burning continuously for several years.
Source: NRDC, Home Idle Load: Devices Wasting Huge Amounts of Electricity When Not in Active Use, issue paper ip:15-03-a, 2015, pp. 8, 14–15 — downloaded and text-extracted 2026-08-28
https://www.nrdc.org/sites/default/files/home-idle-load-IP.pdf
Neither of those is vampire power by any reasonable definition. A light bulb that is on is not in standby. But both sit inside the 23 percent.
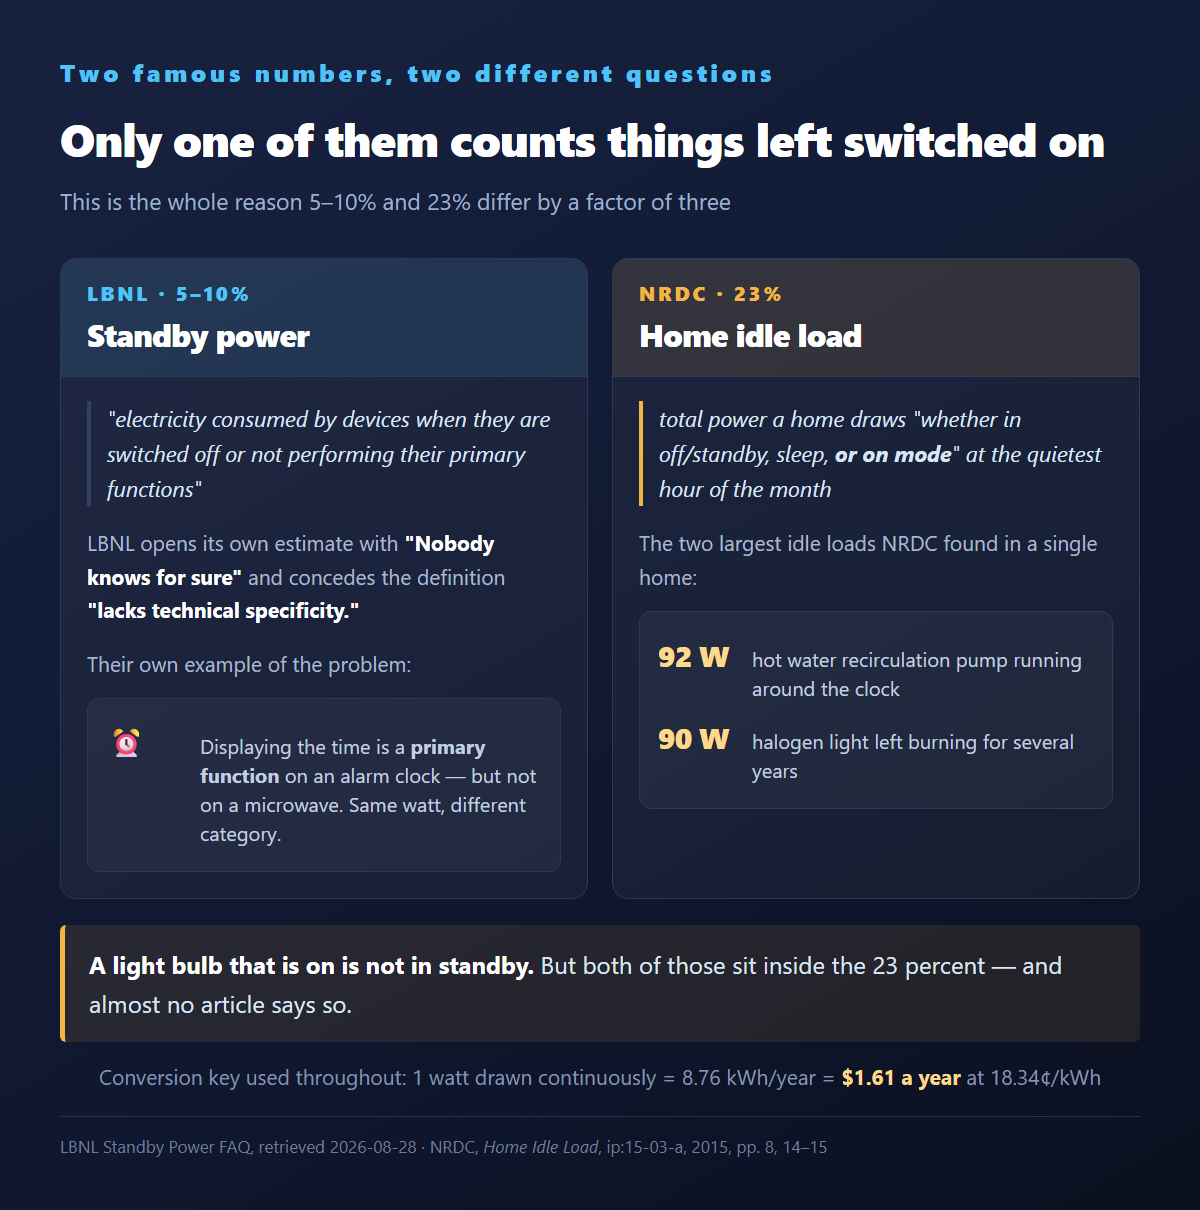
That is the whole reason the two numbers differ by a factor of three. And almost no article says it.
A quarter of that 23% was removed before it was published
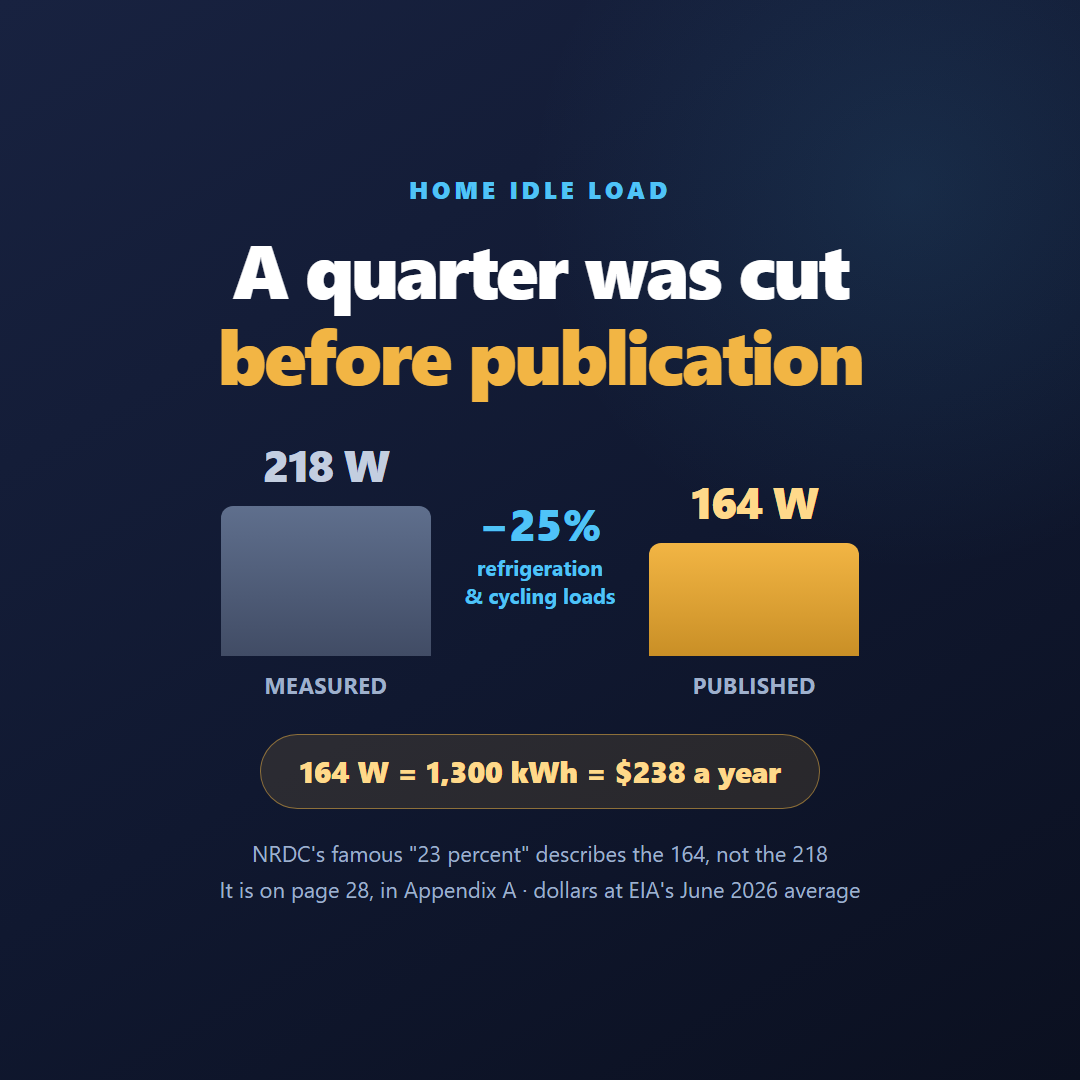
NRDC's meters read 218 watts. The published figure describes 164 watts. The difference is refrigeration and other equipment that cycles — and unplugging cannot touch it.
This is on page 28 of a 36-page PDF, in Appendix A, and it may be the most important sentence in the report.
NRDC's raw measurement across roughly 70,000 PG&E homes was 218 watts of idle load. But their metric — the lowest hourly reading in a month — inevitably catches devices that cycle often enough to be running during every minimum hour. Mostly compressors.
So they estimated that share by comparing 60-minute, 15-minute and 1-minute meter sampling on the same homes. The gaps came out at 18, 29 and 16 percent depending on the comparison. Their conclusion, verbatim:
"the limited data suggest that the intermittent share of idle, including refrigeration and other intermittent loads, may be in the range of 20 to 30 percent. We therefore discounted Minimum Power by 25 percent to estimate a home's always-on load."
218 W − 25% = 164 W. The headline 23 percent describes the 164.
What is in the 54 watts they took out? Refrigerators and freezers cycling, HVAC controllers and transformers, aquarium heaters, wine coolers, heat pump water heaters, dehumidifiers, humidifiers, sump pumps, attic fans, and — an actual entry on NRDC's list — dog bed heaters. NRDC states it plainly: "Some intermittent loads clearly need to operate 24/7, such as refrigerators."
Source: NRDC 2015, Appendix A, p. 28, Table A1, and pp. 10–11 — the report's own methodology appendix
https://www.nrdc.org/sites/default/files/home-idle-load-IP.pdf
One more thing worth knowing about that 25 percent: NRDC labels it rough. The eight-home sample behind one of the comparisons "is too small to be statistically significant," the 15-minute data "may still include some intermittent loads," and the whole exercise is "indicative only and merit[s] further research."
So the number separating 218 from 164 is itself an estimate that its own authors flag as provisional.
How much of the 164 W can a plug reach?
NRDC does not answer this directly, and we are not going to pretend otherwise. But the report bounds it.
Across ten audited homes, the category split of idle load was 51 percent consumer electronics (TVs, computers, printers, game consoles), 34 percent miscellaneous electrical loads (recirculation pumps, towel heaters, GFCI outlets), and 16 percent everything else — heating and cooling 4, lighting 5, kitchen and laundry 6, EV charging 1.
Much of that is not on a plug you would ever pull. Sixty GFCI outlets across ten homes, averaging 1 watt each, were collectively the 11th-largest idle consumer in the sample — and a GFCI outlet is wired into the wall by code. Furnaces averaged 6.7 watts and irrigation systems 3.5 watts. Same story.
And NRDC's own savings scenario never assumes mass unplugging. Their $8 billion national figure assumes every U.S. home gets down to what the best quarter of their sample already achieves — 80 watts per 1,000 square feet — through better products, better settings, timers and smart outlets.
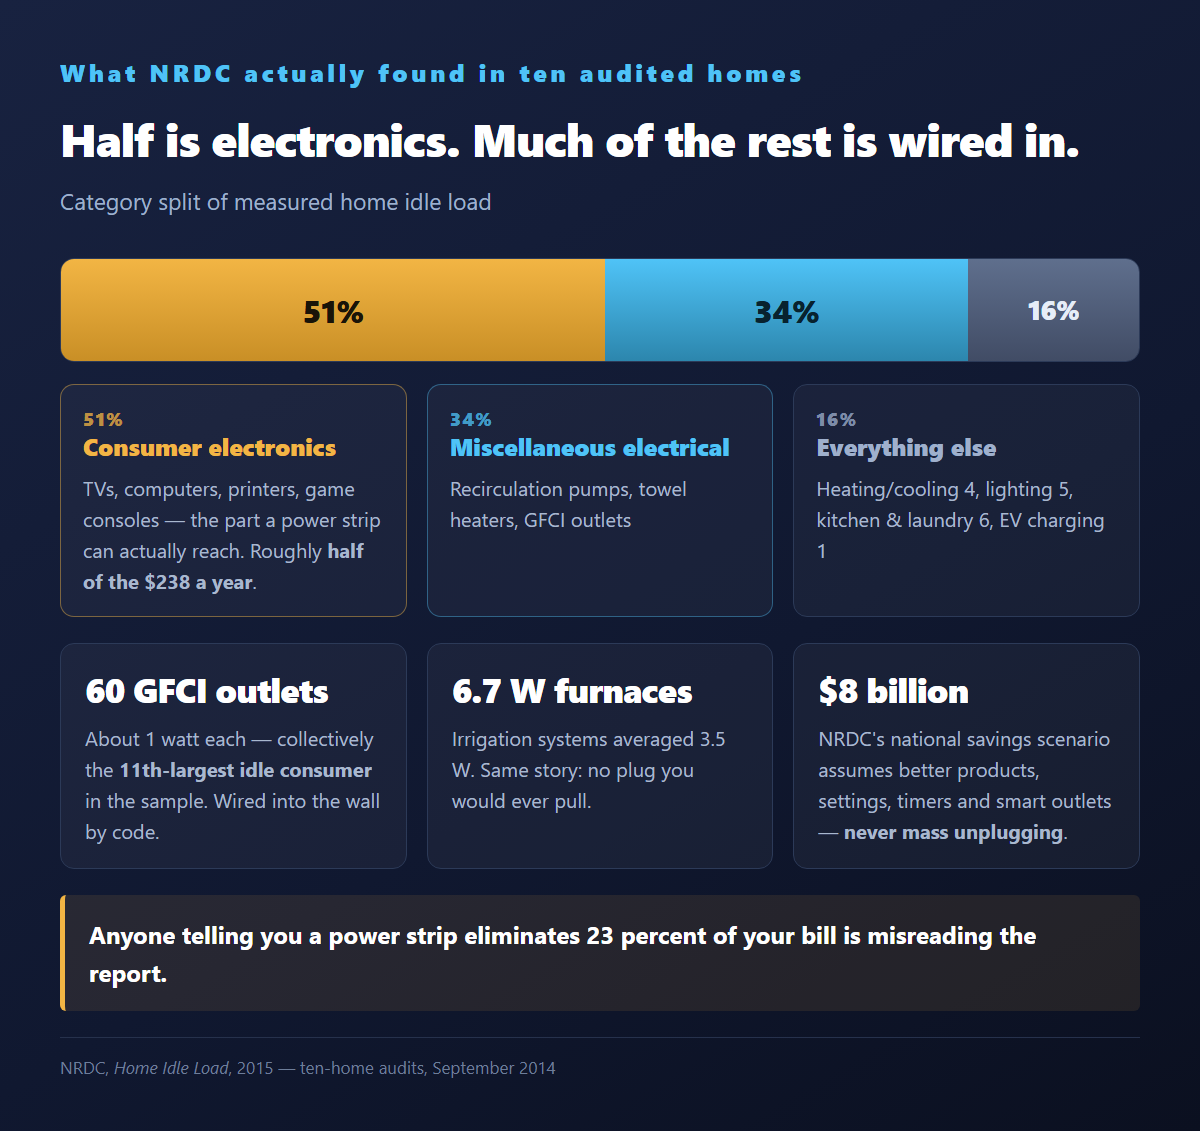
Anyone telling you a power strip eliminates 23 percent of your bill is misreading the report.
Is phantom power really $165 a year?
Not anymore. That is a 2015 figure at a 2015 electricity price. The same energy costs about $238 today — and as a share of an average U.S. home's bill, it is roughly 12 percent, not 23.
Two corrections, and both are easy.
Correction one: the price. NRDC converted 1,300 kWh to dollars at 12.5 cents/kWh, EIA's January 2015 residential average. As of June 2026, the U.S. residential average is 18.34 cents/kWh, up from 17.47 cents a year earlier.
Source: U.S. Energy Information Administration, Electric Power Monthly, Table 5.6.A, released 2026-08-26 — federal statistical agency
https://www.eia.gov/electricity/monthly/epm_table_grapher.php?t=epmt_5_6_a
Our calculation: 1,300 kWh × $0.1834 = $238 per household per year. Anyone still printing "$165" in 2026 is printing an eleven-year-old electricity price.
A rule of thumb you can carry around, derived the same way: 1 watt drawn continuously = 8.76 kWh/year = $1.61/year. LBNL publishes the same rule at an older price — "if a device draws 1 watt constantly for a year, then its energy consumption is 9 kWh/yr. That corresponds to about $1.20 (at a utility tariff rate of 13 cents per kWh)."
Correction two: the denominator. This one matters more, and NRDC flagged it themselves in a sentence nobody quotes:
always-on devices "may represent less than 23 percent of total electricity use in regions with higher overall electricity consumption than California."
The homes NRDC measured used 5,837 kWh a year. Northern California, mild climate, gas heat, gas water heating. The average U.S. residential customer uses 10,791 kWh a year.
Our calculation: 1,300 kWh ÷ 10,791 kWh = 12.0%.
| Household | Annual use | Same 1,300 kWh is |
|---|---|---|
| NRDC's northern California sample | 5,837 kWh | 23% |
| U.S. average | 10,791 kWh | 12.0% |
| Louisiana average | 14,774 kWh | 8.8% |
| Hawaii average | 6,178 kWh | 21% |
Source: EIA FAQ, "How much electricity does an American home use?", 2022 data, page last updated 2024-01-08 — federal statistical agency
https://www.eia.gov/tools/faqs/faq.php?id=97&t=3
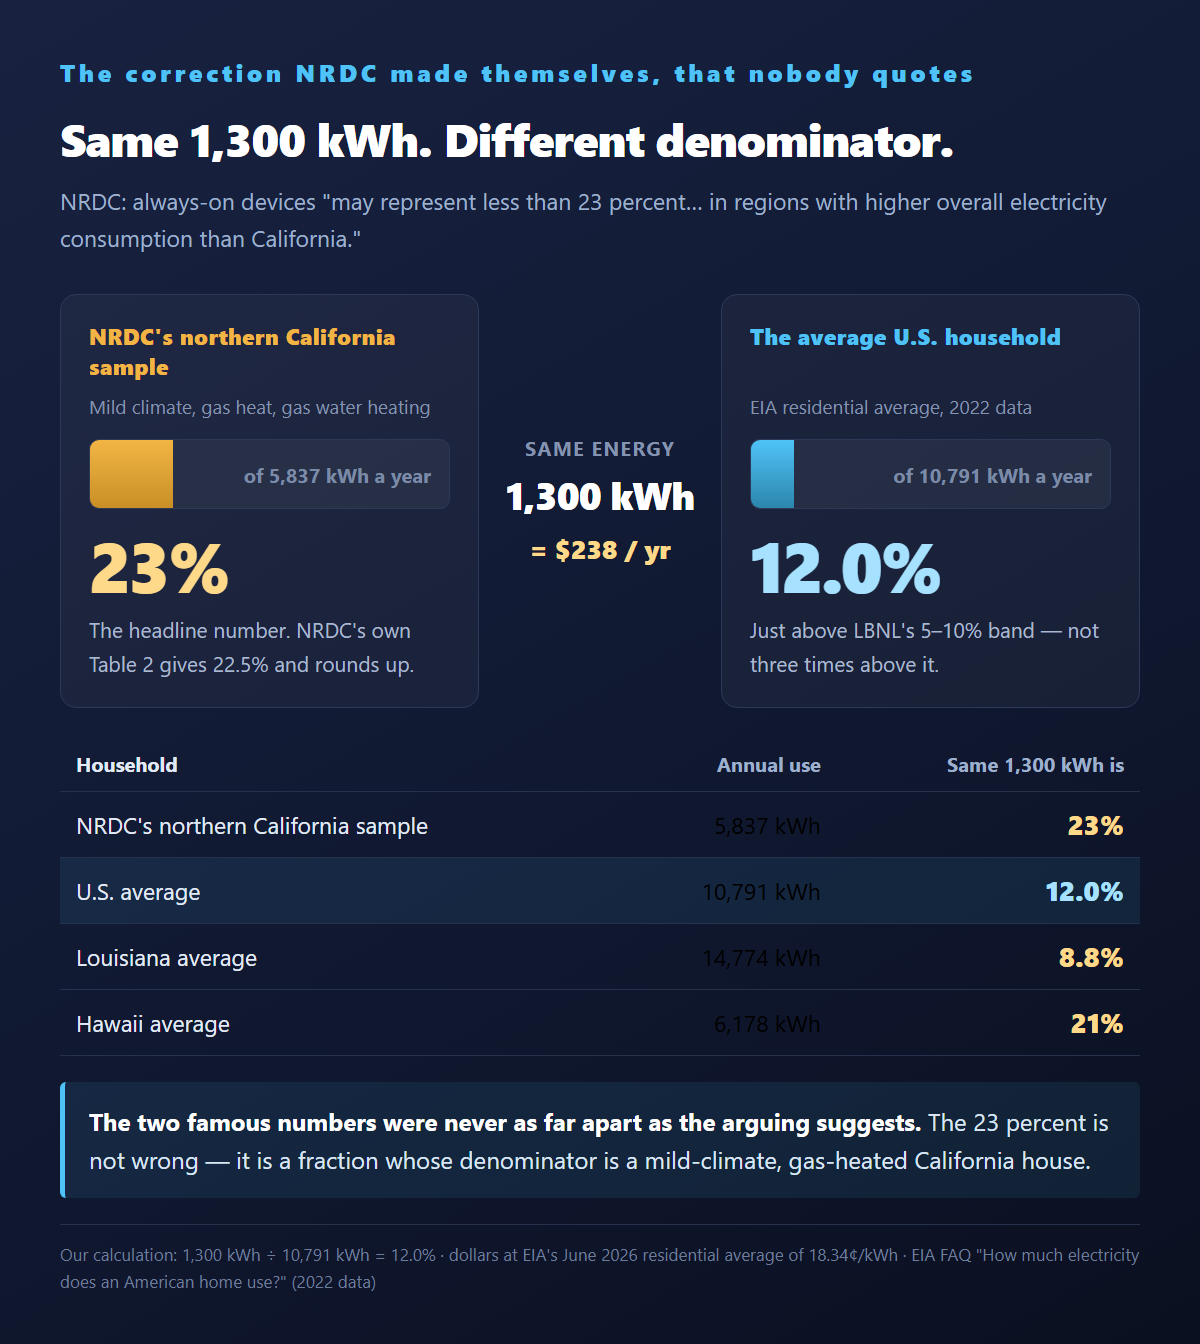
So the 23 percent is not wrong. It is a fraction whose denominator is a mild-climate, gas-heated California house. Applied to an average American home, it lands just above LBNL's 5 to 10 percent band — not three times above it. The two famous numbers were never as far apart as the arguing suggests.
One footnote on precision: NRDC's own Table 2 gives the average as 22.5 percent (24.3 coastal, 21.1 inland), which the report rounds up to "nearly 23 percent" in the headline.
How old is the data behind the 23%?
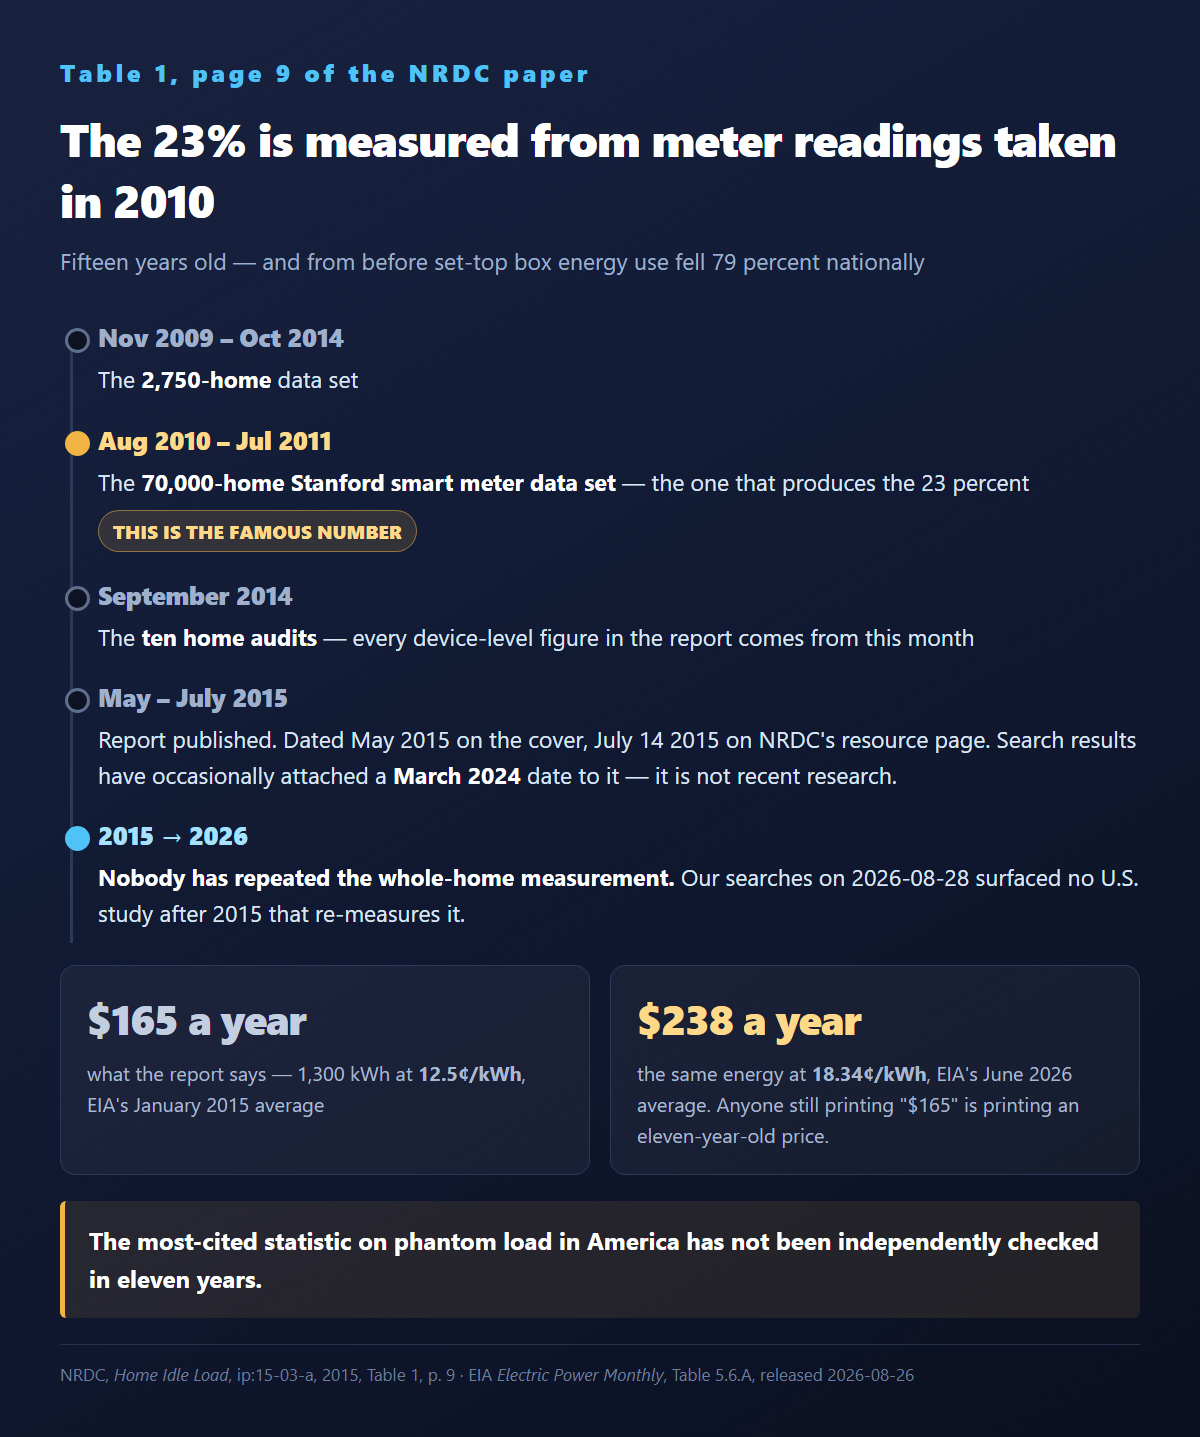
The smart meter readings run from August 2010 to July 2011. They are fifteen years old, and they predate a 79 percent collapse in set-top box power.
Table 1, page 9 of the NRDC paper:
- The 70,000-home Stanford data set — the one that produces 23 percent — covers August 2010 to July 2011.
- The 2,750-home data set spans November 2009 to October 2014.
- The ten home audits were done in September 2014.
The report itself is dated May 2015 on the cover and July 14, 2015 on NRDC's resource page. Search results have occasionally attached a March 2024 date to it. It is not recent research.
Why the vintage matters so much here: NRDC's own third-ranked culprit has since been largely fixed.
Under the CTA/NCTA Set-Top Box Energy Efficiency Voluntary Agreement, U.S. set-top box energy use fell from 32 TWh in 2012 to 8.6 TWh in 2024, and to 6.8 TWh in 2025 — a 79 percent drop. The most common box today, an IP-based non-DVR, uses 26.6 kWh a year.
Our calculation: 26.6 kWh ÷ 8,760 hours = 3.0 watts average draw. NRDC measured 16 to 57 watts for the boxes in a home in 2014. At today's 18.34 cents, a modern box costs about $4.88 a year to run continuously.
Source: CableLabs, "Driving Efficiency at Scale With TV Set-Top Boxes and Internet Devices," 2025-10-11, and NCTA news release, 2026-07-30 — industry voluntary-agreement reporting, prepared and verified by an independent administrator (Evergreen Economics), not government statistics
https://www.cablelabs.com/blog/efficiency-at-scale-set-top-boxes
https://www.ncta.com/news/voluntary-agreements-deliver-strong-energy-efficiency-results-mark-first-year-of-fixed-wireless-participation
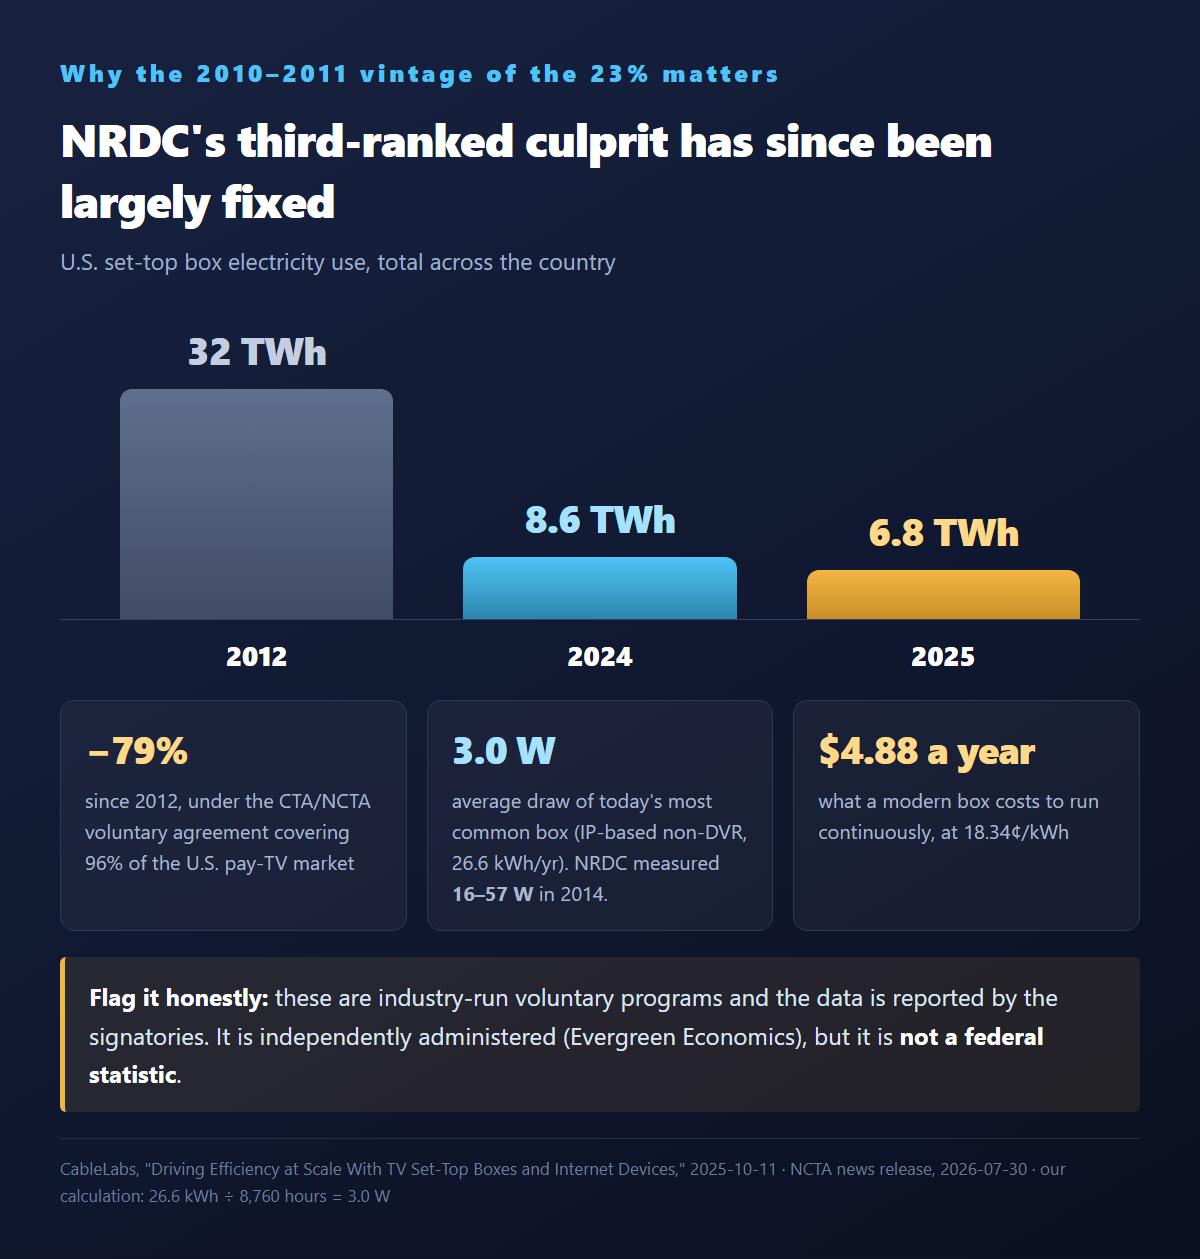
In 2025, 100 percent of new set-top boxes and 99.4 percent of new small network equipment met the programs' efficiency levels, and small network equipment's average ready-state power is down 91 percent since 2015. The agreements cover 96 percent of the U.S. pay-TV market and have been extended through 2028.
Flag it honestly: these are industry-run voluntary programs and the underlying data is reported by the signatories. It is independently administered, but it is not a federal statistic. We are presenting it as audited industry reporting.
LBNL, for its part, is not sure which way the overall trend runs. New products may use "as much as 90% less" standby than what they replace, "although these improvements may be partly offset by the increased power requirements of network connectivity." Their conclusion: "the net effect of these two trends is not clear."
Nobody has repeated NRDC's whole-home measurement since. Our searches on 2026-08-28 surfaced no U.S. study after 2015 that re-measures it. The most-cited statistic on phantom load in America has not been independently checked in eleven years.
What is actually worth unplugging?
Almost nothing dramatic — and the reason is that idle load is a long tail, not a short list.
Here is what NRDC actually measured in ten homes in September 2014. Costs are NRDC's, at 12.5 cents and 22 hours a day.
| Rank | Device | Found in | 24/7 draw | Annual cost (2015 $) |
|---|---|---|---|---|
| 1 | Fishpond equipment | 1 of 10 | 220 W | $220 |
| 2 | Hot water recirculation pump | 3 of 10 | 28–92 W | $28–$93 |
| 3 | Set-top box | 6 of 10 | 16–57 W | $16–$57 |
| 4 | Audio/video gear | 8 of 10 | 7–40 W | $7–$40 |
| 5 | Fan | 1 of 10 | 110 W | $111 |
| 6 | 24/7 lights | 2 of 10 | 4–104 W | $4–$104 |
| 7 | Television | 6 of 10 | 2–54 W | $2–$54 |
| 8 | Aquarium | 3 of 10 | 9–67 W | $9–$67 |
| 9 | Desktop computer | 7 of 10 | 1–49 W | $1–$49 |
| 10 | Modem | 5 of 10 | 5–17 W | $5–$17 |
Source: NRDC 2015, Table 3, p. 17 — ten-home audit, September 2014
https://www.nrdc.org/sites/default/files/home-idle-load-IP.pdf
Look at the top of that list. A fishpond. A recirculation pump. A fan. A light. The biggest offenders are not devices in standby at all — they are appliances doing their jobs, all night, for nobody.
NRDC prints three warnings directly under that table, and all three matter: the equipment measured "include[s] older equipment which may not be representative of the latest models"; newer devices "may have higher idle," specifically instant-on game consoles and smart TVs; and set-top boxes and TVs were present in more homes than the table shows, because some residents asked the auditors not to unplug them.
Why "unplug the worst offender" does not work
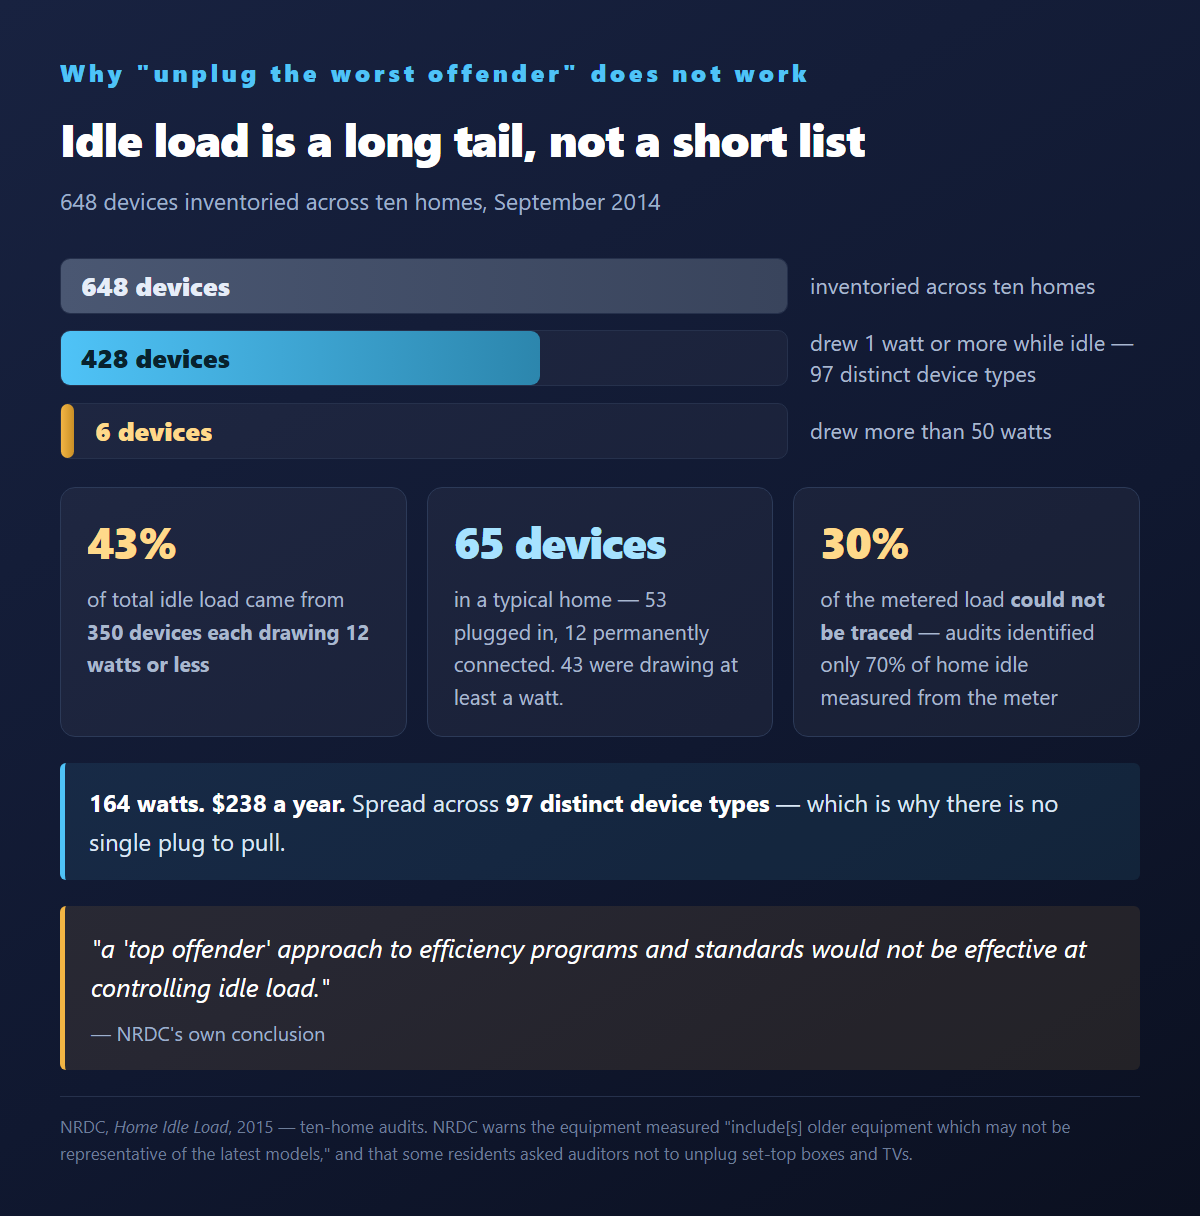
The auditors inventoried 648 devices across ten homes. 428 of them drew 1 watt or more while the house was idle. Only six drew more than 50 watts. And 350 devices each drawing 12 watts or less accounted for 43 percent of total idle load. Grouped by kind, those 428 devices came to 97 distinct device types.
NRDC's own conclusion: "a 'top offender' approach to efficiency programs and standards would not be effective at controlling idle load."
The typical home held 65 electrical devices — 53 plugged in, 12 permanently connected — of which 43 were drawing at least a watt.
And the most honest line in the whole report: across the ten homes, "audits identified 70 percent of home idle measured from the meter." With a power meter and a breaker panel, NRDC could not trace 30 percent of the load it had measured.
What LBNL says to unplug, in 2026
LBNL's current guidance is not "unplug everything." It is a short list of things you have forgotten about: older appliances you rarely or never use, and seasonal devices sitting idle for months. Their specifics include unused VCRs, empty battery chargers, e-bike and golf cart power supplies out of season, rarely used kitchen appliances, scanners and shredders and older printers, a UPS connected to nothing, heated pet beds, "the unused TV in the guest room (along with associated set-top box and sound bar)," and seasonal room air conditioners, humidifiers and air filters.
For things you should not unplug, they prescribe settings instead: enable sleep on computers, put a hot water circulation pump on a timer, switch off one side of a bottled water dispenser, and turn off a heated toilet seat in summer.
Source: Lawrence Berkeley National Laboratory, "What Can I Unplug Now?", retrieved 2026-08-28 — the national lab's own consumer guidance
https://standby.lbl.gov/what-can-i-unplug-now
Does the U.S. limit standby power on the products you buy?
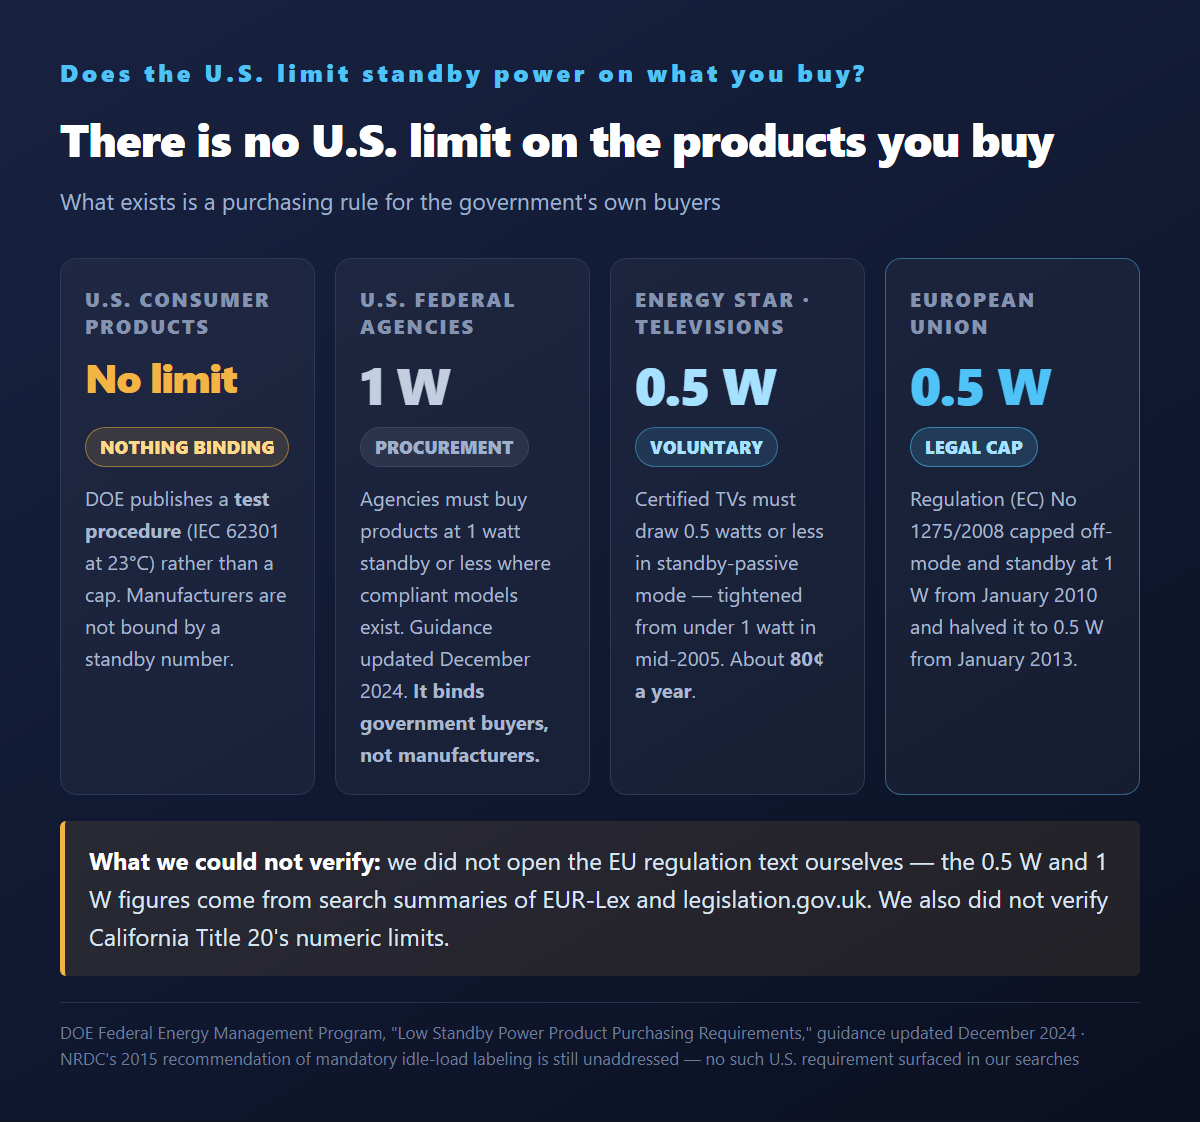
No. There is no federal standby power limit on consumer products sold in the United States. What exists is a purchasing rule for the government's own buyers.
Federal agencies "are required to purchase energy-consuming products with a standby power level of 1 watt or less" when compliant models exist, administered by DOE's Federal Energy Management Program, with priority categories of computers, displays, imaging equipment, televisions and telephones. That guidance was updated in December 2024. It binds government buyers, not manufacturers.
Source: U.S. DOE Federal Energy Management Program, "Low Standby Power Product Purchasing Requirements," guidance updated December 2024 — federal procurement guidance, not a product standard
https://www.energy.gov/femp/low-standby-power-product-purchasing-requirements-and-compliance-resources
DOE does publish a test procedure rather than a limit: standby power is "the lowest power consumption while plugged into the mains power supply," measured per IEC 62301 at 23°C.
ENERGY STAR is voluntary but does set a number — certified televisions must draw 0.5 watts or less in standby-passive mode, tightened from under 1 watt in mid-2005.
The EU regulates by law rather than by procurement. Under Commission Regulation (EC) No 1275/2008, off-mode and standby power was capped at 1 watt from January 2010 and halved to 0.5 watts from January 2013.
Note on this one: we did not open the EU regulation text ourselves. The 0.5 W and 1 W figures come from search summaries of EUR-Lex and legislation.gov.uk. Verify before relying on it as a precise legal claim.
California handles specific categories under Title 20 rather than standby generally — battery charger systems were adopted in January 2012 and became mandatory for consumer chargers manufactured on or after January 1, 2013, with the standard applying to maintenance-mode energy, which is exactly the idle draw at issue here. Televisions and displays remain under active rulemaking. We did not verify Title 20's numeric limits.
NRDC's policy recommendation from 2015 is still unaddressed: mandatory idle-load labeling, so a box would read "This product consumes 10 watts in standby, which may cost you $50 to $130 in electricity over five years." No such U.S. requirement surfaced in our searches.
Frequently asked questions
Q. Does unplugging appliances save electricity?
A. Yes, but the amount is smaller than the headline suggests. NRDC's 164 W always-on figure works out to 1,300 kWh a year, or about $238 at June 2026 prices — and roughly half of that is consumer electronics, part of the rest is hardwired, and a quarter of the original measurement was refrigeration that was already removed before publication.
Q. How much does 1 watt cost per year?
A. About $1.61, at EIA's June 2026 residential average of 18.34 cents/kWh. The math: 1 W × 24 hours × 365 days ÷ 1,000 = 8.76 kWh, × $0.1834 = $1.61.
Q. How much does a set-top box cost to run?
A. A current IP-based non-DVR uses 26.6 kWh a year, which is about 3.0 watts average draw and roughly $4.88 a year. Older boxes were far worse — NRDC measured 16 to 57 watts in 2014.
Q. Is it worth unplugging your TV at night?
A. An ENERGY STAR certified TV draws 0.5 watts or less in standby-passive mode, which is about 80 cents a year. LBNL's own list does not include the TV you actually watch — it includes the unused TV in the guest room, along with its set-top box and sound bar.
Q. Do smart power strips actually save money?
A. NRDC lists timers and smart outlets among the tools in its savings scenario, so they are part of the accepted toolkit. But the savings are bounded by what is on the strip. If you are targeting consumer electronics, you are targeting roughly half of a 164 W figure that itself has an unquantified hardwired share.
Q. What percent of my electric bill is standby power?
A. LBNL says 5 to 10 percent and prefaces it with "nobody knows for sure." NRDC's 23 percent is a northern California number on a 5,837 kWh household. Applied to the 10,791 kWh U.S. average, the same energy is about 12 percent.
What these numbers leave you with
We did not set out to tell you to unplug things or to leave them plugged in. We set out to find where the numbers came from. Here is what we found.
- The 23 percent had a quarter removed before publication — 218 watts measured, 164 watts published, refrigeration and cycling loads in between. It is in Appendix A, page 28.
- The data is from August 2010 to July 2011, from before set-top box energy use fell 79 percent nationally.
- The $165 is a 2015 price. The same energy is about $238 today. And on an average American household's consumption, it is roughly 12 percent, not 23.
- The biggest single "vampire" NRDC found was a water pump and a light left on — neither of which is standby power.
And then there is the sentence that gets left out of every consumer article on this subject. It comes from the national lab whose research produced the 5 to 10 percent figure in the first place:
"Limited research suggests that an informed and aggressive approach can reduce standby use by about 20%. Frankly, there are more productive ways to save energy with an investment of an hour but if high standby energy use stands between you and the goal of a zero energy home, then it's an hour well spent."
Source: Lawrence Berkeley National Laboratory, Standby Power FAQ, retrieved 2026-08-28
https://standby.lbl.gov/frequently-asked-questions
Our calculation of what that 20 percent implies: 20 percent of 1,300 kWh is 260 kWh, or about $48 a year at today's price.
Forty-eight dollars is not nothing. It is also not 23 percent of anything. Whether an hour of walking around your house with a power meter is worth it is a call only you can make — but now you are making it against the real number rather than a headline.
What we could not confirm, stated plainly:
- We found no U.S. study published after 2015 that repeats NRDC's whole-home smart-meter measurement. If one exists, our searches on 2026-08-28 did not surface it.
- We did not open the EU Ecodesign regulation text directly; the 0.5 W and 1 W figures are from search summaries.
- We did not verify California Title 20's numeric limits.
- NRDC does not state the household count behind its $19 billion national figure. Dividing $19B by $165 gives about 115 million households, which is consistent with the period — but that is our reverse-derivation, not their statement.
- One widely shared vendor figure — a home energy monitor company reporting an average of 251 W always-on across its customers — comes from self-selected buyers of energy monitors, and the same article misdescribes NRDC's California result as a U.S. one. We are not treating it as evidence.
We will update these figures rather than the year in the headline. If a new whole-home measurement appears, that is the number we will want.


Comments
Post a Comment