How Much Does Car Insurance Go Up After an Accident?
There is no national answer to this question.
Search it and you'll get a number — usually somewhere between 45% and 49%.
Last updated: 3 September 2026 · Figures and rules in this post are current as of this date.
That number is real. It is also an average of things that don't average well.
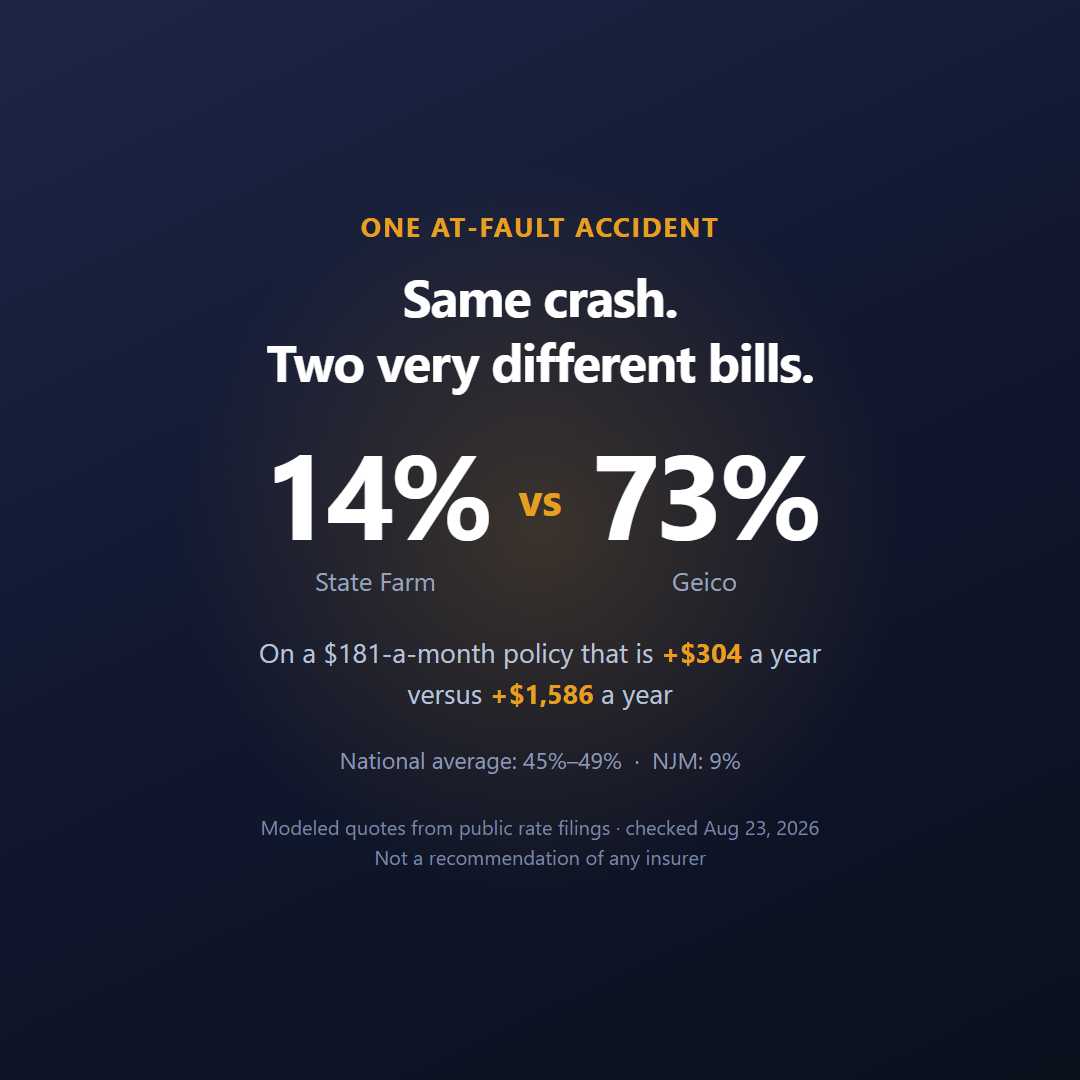
Priced against the same at-fault accident, State Farm's average increase is 14%. Geico's is 73%. Same crash, same data vendor, same publication. Five times the penalty.
So the honest answer to "how much does car insurance go up after an accident" is: it depends on which company holds your policy and which state you live in — and unlike a lot of "it depends" answers, this one has a paper trail you can actually follow. That's what this article does.
Figures in this article carry the publication dates of their sources. Rate data was last checked on August 23, 2026.
How much does one at-fault accident actually cost?
Roughly 45% to 49% more on a full-coverage policy, depending on which 2026 study you read — but the spread between insurers is far wider than the gap between studies.
Start with the headline number.
One at-fault accident raises full-coverage premiums by an average of 49%, or about $102 per month.
Source: ValuePenguin, "How Much Will My Car Insurance Rates Go Up After a Crash in 2026?", updated July 17, 2026 — ⚠️ insurance comparison site (lead generation is the business model); rates modeled from public company filings via Quadrant Information Services
https://www.valuepenguin.com/how-does-accident-affect-my-car-insurance-rates
Now break that average apart by company.
| Insurer | Average increase after one at-fault accident |
|---|---|
| NJM (sold in only 5 states) | 9% |
| State Farm | 14% |
| — national average — | 49% |
| Geico | 73% (described as the biggest of any major U.S. insurer) |
Source: ValuePenguin, updated July 17, 2026 — ⚠️ insurance comparison site; modeled from public rate filings via Quadrant Information Services
https://www.valuepenguin.com/how-does-accident-affect-my-car-insurance-rates
Percentages are slippery, so put dollars on them. The same source uses a baseline of $181 a month for its sample driver, which is $2,172 a year.
- A 14% increase on that policy is about $304 more a year.
- A 73% increase is about $1,586 more a year.
That's a difference of roughly $1,280 a year for the exact same accident — a monthly car payment's worth, decided by whose name is on your policy.
(Those two dollar figures are my own arithmetic, applying the published percentages to the published $181 baseline. They are an illustration of scale, not a quote.)
One thing to be clear about before going further. None of these percentages are official statistics. They aren't survey results and they aren't regulator data. They are modeled quotes — a fixed hypothetical driver priced against insurers' publicly filed rate manuals. Nobody actually paid these amounts. What they're good for is showing the shape of the difference, and the shape is dramatic.
Why does the same crash cost 14% at one insurer and 73% at another?
Because there is no national surcharge schedule. Every insurer files its own rating plan with every state it sells in, and states differ on what an insurer is even allowed to count.
This is the structural fact underneath the whole article. In the U.S., "how much does an accident raise your rate" is not one question with one answer. It's roughly 50 questions times however many carriers operate in your state.
Those filings aren't secret, either. Insurers submit rates, rules and forms to each state's insurance department through SERFF (System for Electronic Rate and Form Filing), run by the NAIC. The filings are publicly searchable at no fee through the NAIC's SERFF Filing Access portal, and state departments point consumers to the same place.
Sources: Washington State Office of the Insurance Commissioner, "Search company filings with SERFF Filing Access" — state insurance regulator (primary)
https://www.insurance.wa.gov/insurers-regulated-entities/rate-and-form-filing/search-company-filings-serff-filing-accessTexas Department of Insurance, "Search the System for Electronic Rates and Forms Filing (SERFF)" — state insurance regulator (primary)
https://tdi.texas.gov/company/serff/index.html
So the surcharge grid is technically public. It's just buried in per-state, per-company filings instead of laid out as a comparison anyone can scan. That's precisely why the popular answer to "how much will my rates go up" comes from a quote-modeling vendor rather than from a rate manual.
I looked for a state insurance department that publishes a side-by-side, company-by-company sample premium for a driver with one at-fault accident. I did not find one. I also can't tell you that none exists — only that I couldn't locate it.
There's a practical trap waiting for anyone who tries anyway, and it's worth flagging before you go looking. "GEICO" is not one company inside SERFF — it's a group of roughly 20 to 30 separate legal insurance entities, including Government Employees Insurance Company, GEICO General Insurance Company, GEICO Indemnity Company, GEICO Casualty Company, GEICO Choice Insurance Company, GEICO Secure Insurance Company and GEICO Advantage Insurance Company. Which one actually underwrites your policy depends on your state and how it was sold. Search SERFF for "GEICO" generically and you can pull up the wrong entity's filing without realizing it. Your own policy's declarations page shows the exact legal entity name — that's what to search, not the brand name.
Source: Illinois Department of Insurance, "GEICO Group Code: 31" — state insurance regulator (primary, entity list)
https://idoi.illinois.gov/content/dam/soi/en/web/insurance/companies/documents/geico-group-code-31.pdf
The same structure applies past GEICO. Large carriers routinely sell through several affiliated entities in the same state, each of which can carry its own filed rate manual.
How much does GEICO raise your rates after an accident?
Two honest numbers exist here, and they don't match — but neither one is wrong.
GEICO's own site answers this question in the vaguest way a company reasonably can: rates typically rise "anywhere from 0% to 50% or more" after an at-fault accident, and the effect can last "three to five years on average."
Source: GEICO, "How much does auto insurance go up after a claim?" — insurer (first-party)
https://www.geico.com/claims/claimsprocess/accident-impact-on-rate/
Independent studies that price a standardized driver against real filed rate data land somewhere much more specific. ValuePenguin, cited above, puts GEICO's average at-fault increase at 73% — the largest of any major insurer it studied. Forbes Advisor, running its own modeled quotes through the same data vendor, found 73% for at-fault accidents involving property damage only, and 77% for accidents involving injuries.
Source: Forbes Advisor, "How Much Does Car Insurance Go Up After An Accident?", 2026 — ⚠️ insurance comparison site; rates modeled via Quadrant Information Services
https://www.forbes.com/advisor/car-insurance/rate-increase-after-accident/
Two comparison sites, run by two different companies, landed on the same number independently. That convergence is what makes 73% worth taking seriously — though, like every figure from these sites, it's a modeled quote from a hypothetical driver, not a rate table anyone actually paid.
State Farm sits at the other end in both studies: 14% (ValuePenguin) and 21% to 22% (Forbes Advisor, depending on whether the accident involved injuries) — the same 14%-vs-73% gap this article opened with.
Why the distance between GEICO's own "0% to 50%" and the studies' "73%"? They're not measuring the same thing. GEICO's range is a liability-conscious disclosure meant to cover every state, every severity, every driver GEICO insures — a scraped bumper in Wyoming and a multi-injury crash in California both have to fit inside it. The comparison sites' 73% is a single number produced by pricing one specific hypothetical driver against GEICO's filed rate manual, repeated across ZIP codes. A broad company disclosure and a narrow modeled quote can both be accurate and still look nothing alike.
Two states where your insurer doesn't get to decide
In most of the country, the accident surcharge is a business decision each insurer makes for itself. In North Carolina, it's a number written into regulation that every insurer has to use.
North Carolina's Safe Driver Insurance Plan (SDIP) is a state-mandated point-and-surcharge system — insurers operating in North Carolina don't set their own accident surcharge percentage, they apply the state's. An at-fault accident is assigned 4 points, which independent summaries of the SDIP schedule put at a 45% surcharge for 3 years; a DWI carries 12 points and a 400% surcharge. For violations of 4 points or more (other than plain speeding) occurring on or after July 1, 2025, that surcharge period extends to 5 years.
Sources: North Carolina Department of Insurance, "Safe Driver Incentive Plan" — state insurance regulator (primary, program overview)
https://www.ncdoi.gov/consumers/auto-and-vehicle-insurance/safe-driver-incentive-planThe 45%/400% figures themselves are corroborated across multiple independent North Carolina insurance-law sites rather than a directly retrieved NCDOI point-and-surcharge table — the program's existence and structure are confirmed; treat the exact percentages as well-corroborated but secondary-sourced.
Worth connecting back to the state table above: North Carolina posted one of the smallest dollar increases in LendingTree's study, at $499.33 a year — plausibly because a regulator-capped, published schedule produces a smaller, more predictable number than a market where each insurer prices the same crash however it wants.
Massachusetts, covered in detail above, runs a similar state-set point system rather than leaving the number to each carrier. Two different states, same structural answer — and as noted earlier, the price of a single point there was one of the details this research couldn't retrieve either.
New Jersey looks like it belongs in the same category and doesn't. Its "Merit Rating Program" is a surcharge the state itself collects, separate from anything the insurer charges — paid to the New Jersey Motor Vehicle Commission once a driver accumulates 6 or more points on their license, at $150 a year for 3 years plus $25 a year for each point above 6. That's a state fee layered on top of whatever New Jersey lets the insurer charge on its own; it doesn't replace or cap the insurer's premium increase the way North Carolina's schedule does.
Source: New Jersey Merit Rating Program, summarized from N.J.S.A. 17:29A-35 — secondary summaries cross-checked across multiple sources; the statute itself was not read directly for this article
https://en.wikipedia.org/wiki/New_Jersey_Surcharge
California takes a third approach: it doesn't fix a surcharge percentage at all, but it guarantees something an insurer can't take away. Under Proposition 103, a California insurer cannot raise a not-at-fault driver's rate, and it cannot strip that driver of the mandatory 20% Good Driver Discount — a discount every California insurer must give to qualifying drivers, regardless of which company they're with.
Source: Cal. Code Regs. tit. 10, §§ 2632.12–2632.13.1, "Good Driver Discount" — state regulation (primary)
https://www.law.cornell.edu/regulations/california/10-CCR-2632.12
So "which company raises rates the most" is a question with a real answer in most of the country — and a question that doesn't fully apply in North Carolina, where the state already answered it for every insurer at once.
Where does the "Progressive raises rates 101%" number actually come from?
Not from Progressive. That's worth saying plainly, not as an accusation of another site — just as something worth checking before repeating it.
A specific claim circulates in search-summary and aggregator content: Progressive raises rates "101% on average… according to the company." That attribution doesn't hold up. Progressive's own page on the topic was checked directly, and it contains no percentage figure at all — only that an accident "will almost always raise your insurance rate" and that the exact amount "will depend on the type of accident and your insurer."
Source: Progressive, "How Much Does Insurance Go Up After an Accident?" — insurer (first-party)
https://www.progressive.com/answers/how-accidents-impact-insurance/
This reads like a case of a comparison site's modeled estimate getting relabeled, somewhere down the chain, as an official company statement. We're not going to repeat "101%, according to Progressive," and we're not going to invent a replacement percentage of our own — Progressive simply hasn't published one.
What Progressive does confirm on its own site is the small-accident forgiveness already mentioned above: Small Accident Forgiveness for claims of $500 or less, Large Accident Forgiveness after five accident-free years with the company, and a purchasable Accident Forgiveness add-on.
Source: Progressive, "What Is Accident Forgiveness?" — insurer (first-party)
https://www.progressive.com/answers/what-is-accident-forgiveness/
Does the state you live in change it? (And why do two 2026 studies disagree?)
Yes, enormously — California is the most expensive state to have an at-fault accident in and Pennsylvania is among the cheapest. But the two big 2026 studies put very different numbers on the same ranking.
Here is the awkward part, laid out plainly.
| State | ValuePenguin (Jul 2026) | LendingTree (Feb 2026) |
|---|---|---|
| California | 98% | 70.7% |
| New Jersey | 74% | 62.7% |
| New York | 26% | 22.4% |
| Wyoming | 34% | 31.7% |
| Pennsylvania | 13% | 16.5% |
Sources: ValuePenguin, updated July 17, 2026 — ⚠️ comparison site; https://www.valuepenguin.com/how-does-accident-affect-my-car-insurance-rates
LendingTree, "One At-Fault Accident Can Add Thousands to Drivers' Insurance Costs," published February 23, 2026 — ⚠️ comparison site; https://www.lendingtree.com/insurance/at-fault-accidents-study/
Both use rate data from Quadrant Information Services, sourced from public insurance company filings.
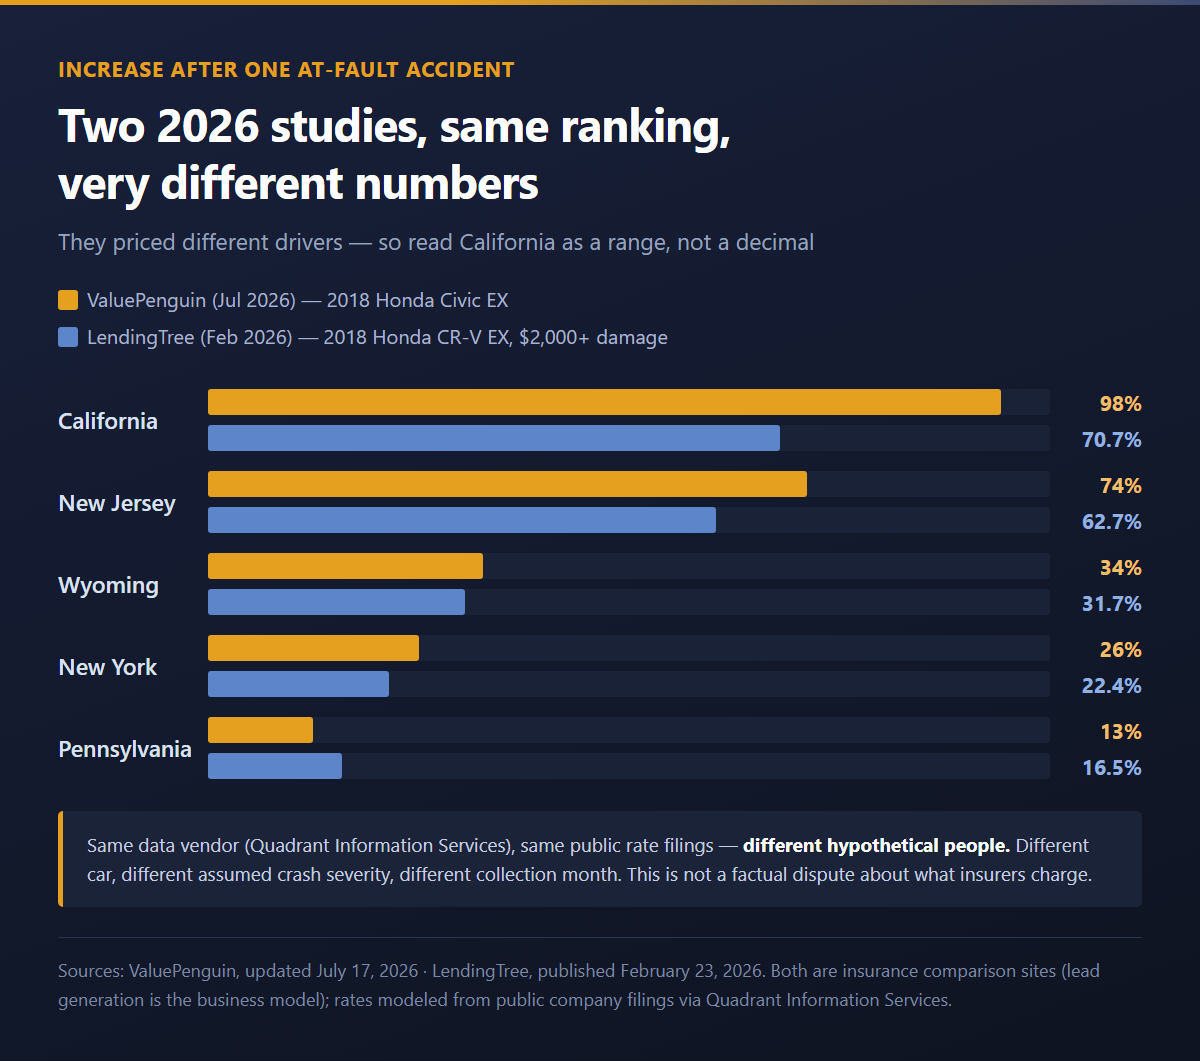
Both studies agree on the map. California and New Jersey at the top, Pennsylvania and New York at the bottom. Both disagree, sometimes by nearly 30 percentage points, on how big the number is.
Why? Because they modeled different drivers.
- ValuePenguin priced a 30-year-old man with good credit driving a 2018 Honda Civic EX, and reported a national average of 49%.
- LendingTree priced a 30-year-old man with good credit driving a 2018 Honda CR-V EX, defined the accident as one causing at least $2,000 in property damage, collected the data in January 2026, and reported 45.0% nationally — $1,030.95 more a year, or $3,092.84 over three years.
Different car, different assumed crash severity, different collection month, different weighting across states. Same vendor, same underlying filings. This isn't a factual dispute about what insurers charge. It's two different hypothetical people.
Which means the responsible way to state California's number is as a range: roughly 70% to nearly 100%, depending on which model you use. Anyone quoting a single decimal place is over-claiming.
LendingTree's study also picks up something the percentage tables hide — the biggest dollar increases don't land in the biggest percentage states. Arizona topped the list at $2,091.75 more a year, followed by New Jersey at $1,999.64 and Louisiana at $1,875.50. At the other end, Pennsylvania added $351.60 and Wyoming $419.17.
Age moves it too. A 20-year-old pays an average of $2,024 more a year after an accident; drivers in their 50s and 60s pay about $1,072.
Source: LendingTree, published February 23, 2026 — ⚠️ comparison site; data from Quadrant Information Services / public rate filings
https://www.lendingtree.com/insurance/at-fault-accidents-study/
Does a $500 fender bender raise your rates?
Barely. A $1,000 one does. The jump between those two numbers is the single sharpest edge in the whole system.
Look at what happens as the claim size climbs.
| Damage | Monthly rate | Change from no accident |
|---|---|---|
| No accident | $181 | — |
| $500 property damage | $184 | +1.7% |
| $1,000 property damage | $216 | +19.3% |
| $2,000 property damage | $227 | +25.4% |
| Injuries | $228 | +26.0% |
Source: ValuePenguin, updated July 17, 2026 — ⚠️ comparison site (percentages calculated from the published dollar figures)
https://www.valuepenguin.com/how-does-accident-affect-my-car-insurance-rates
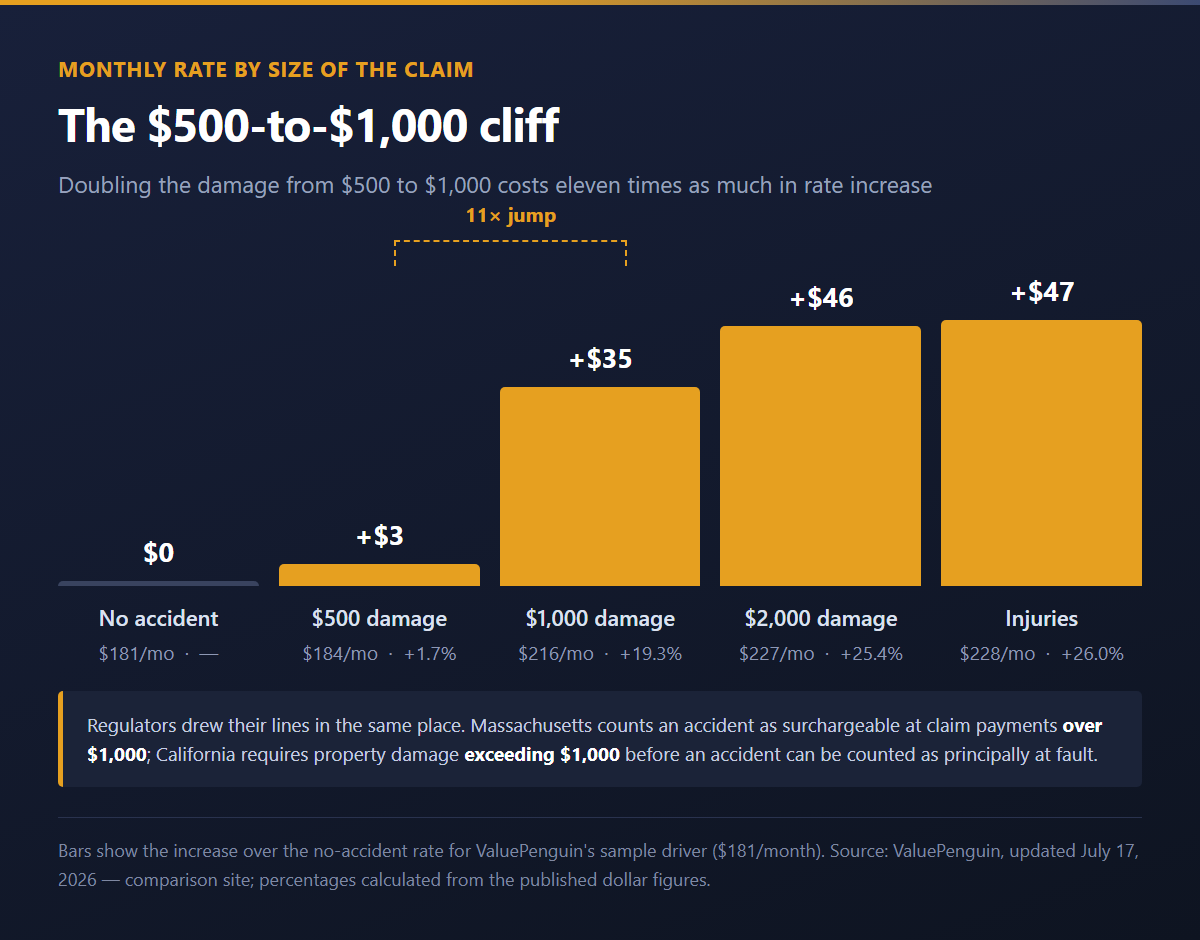
Doubling the damage from $500 to $1,000 costs eleven times as much in rate increase. Doubling it again, from $1,000 to $2,000, adds only six more percentage points.
That's not a coincidence, and it lines up with where regulators drew their own lines. Massachusetts sets its surchargeable-accident threshold at claim payments over $1,000. California requires property damage exceeding $1,000 before an accident can be counted as principally at fault (more on both below). The pricing curve and the regulatory line sit in the same place.
Some carriers build the same threshold into their product. ValuePenguin notes that "Progressive typically doesn't raise your rates after a minor accident" because most of its policies include small-accident forgiveness covering a first claim under $500 in total damage.
Source: ValuePenguin, updated July 17, 2026 — ⚠️ comparison site
https://www.valuepenguin.com/how-does-accident-affect-my-car-insurance-rates
The practical takeaway isn't "never file a claim." It's that a scraped bumper and a crumpled door are not the same event in your insurer's pricing model, even though they're the same event in your driveway.
Can they raise your rate if you weren't at fault?
In most states, yes — and major insurers actually do it. Only a handful of states forbid it.
This surprises people, so let's take the law first.
California and Oklahoma both prohibit raising rates on drivers involved in not-at-fault accidents. Washington does it through a driving-records statute:
"Any policy of insurance may not be canceled, nonrenewed, denied, or have the rate increased on the basis of information regarding an accident included in the abstract of a driving record, unless the policyholder was determined to be at fault."
Source: Washington State Legislature, RCW 46.52.130(2)(e)(iii) — state statute (primary)
https://app.leg.wa.gov/RCW/default.aspx?cite=46.52.130
One caveat worth knowing: that protection is tied to fault, and Washington applies pure comparative negligence — so a driver assigned even a small share of blame may fall outside the carve-out. I saw that reading in law-firm commentary rather than in the statute itself, so treat it as an open question rather than settled law.
Now the practice. The Consumer Federation of America tested this directly, pulling quotes for a hypothetical driver across 10 cities including New York City, Baltimore, Chicago and Kansas City, from Progressive, GEICO, Farmers, Allstate and State Farm.
- Progressive applied surcharges in every location where it was permitted to.
- GEICO and Farmers sometimes raised rates by 10% or more for a not-at-fault accident.
- Allstate occasionally penalized not-at-fault drivers.
- State Farm never increased premiums for not-at-fault accidents.
- Average penalty: $78 more (6.6%) for higher-income drivers, $208 more (9.6%) for moderate-income drivers. Excluding State Farm, those rose to $99 (8.3%) and $264 (12.1%).
- The legal protection was absent in 8 of the 10 test cities.
"Innocent drivers who don't cause accidents should not be charged more because someone else hit them." — J. Robert Hunter, CFA Insurance Director
Source: Consumer Federation of America, "Major Insurance Companies Raise Premiums After Not-At-Fault Accidents," February 13, 2017 — nonprofit consumer advocacy group; CFA collected the quote data itself
https://consumerfed.org/press_release/major-insurance-companies-raise-premiums-not-fault-accidents/
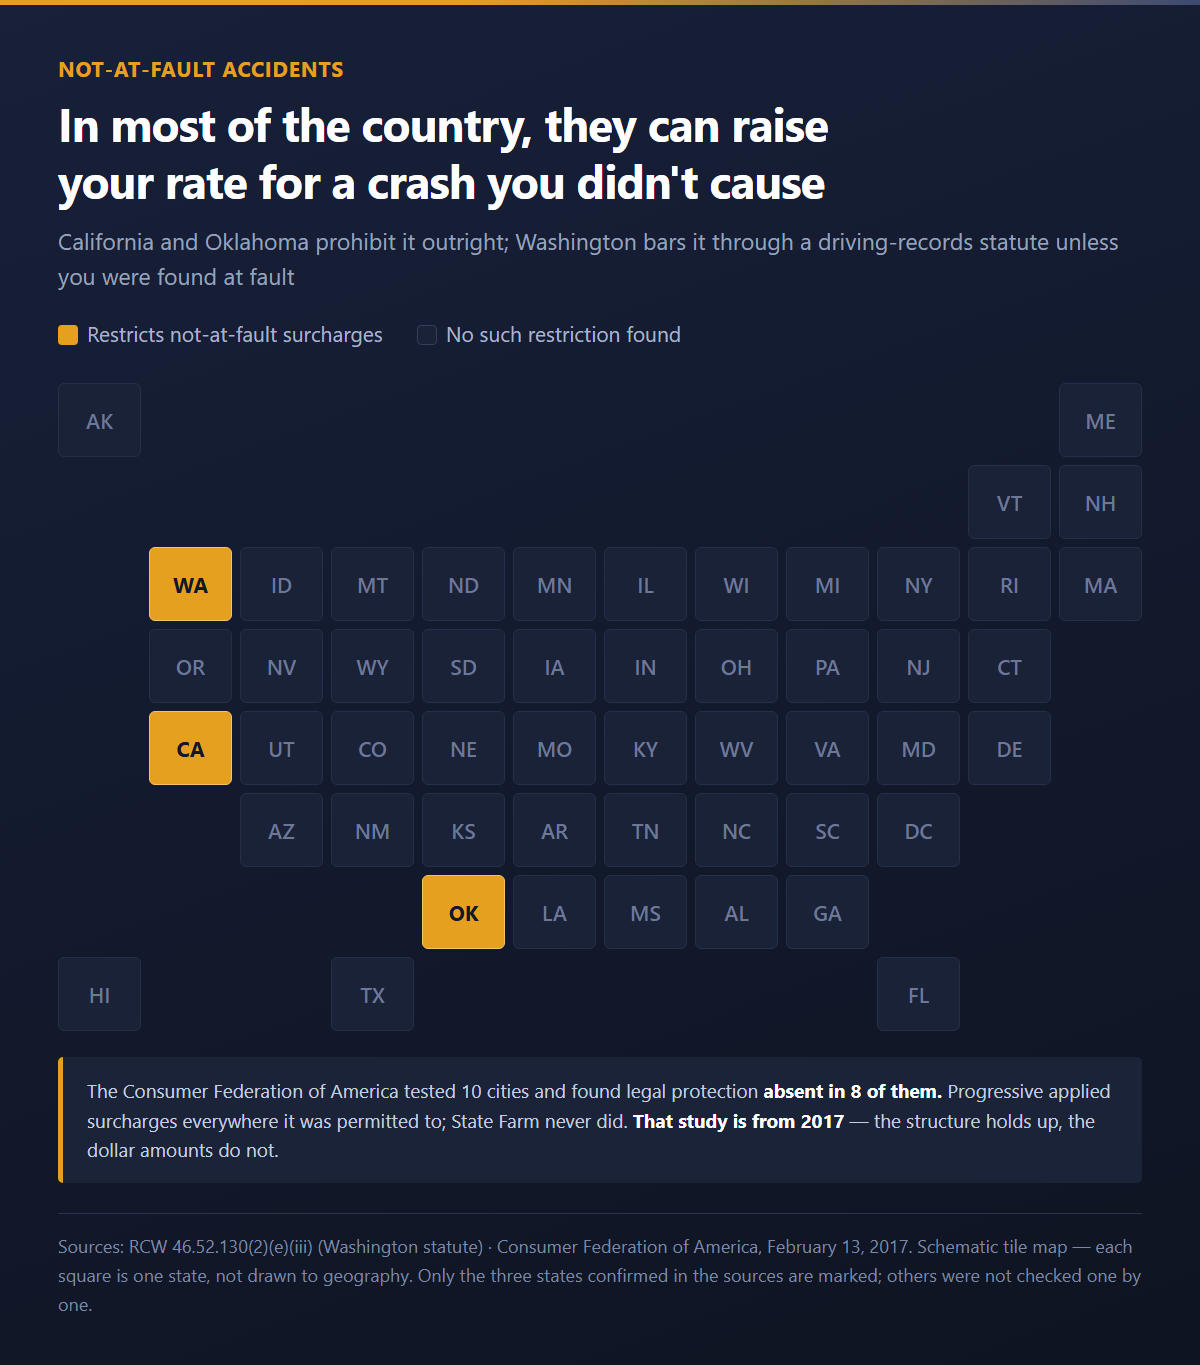
That study is from 2017, and I have to flag it loudly. The dollar amounts are nine years old and should not be read as current prices. I looked for a more recent company-by-company comparison of not-at-fault surcharges and could not find one. What holds up is the structure: in most of the country this is legal, carriers vary wildly in whether they do it, and the difference between carriers is bigger than the difference the accident itself makes.
California doesn't just ban the surcharge in the abstract — it writes out when a driver is presumed not to be at fault. Under 10 CCR § 2632.13, there are rebuttable presumptions of no fault where the vehicle was lawfully parked, where it was struck in the rear by another vehicle (and the driver wasn't cited for a moving violation), in hit-and-runs reported promptly, in accidents caused by animals, birds or falling objects, and in single-vehicle accidents caused by an unforeseeable road hazard.
The same section sets the bar for counting an accident against you at all: your actions must have been at least 51% of the legal cause, and the accident must have involved bodily injury or death, or property damage exceeding $1,000. An insurer "shall not make a determination that a driver was principally at-fault … unless the insurer first conducts an investigation," and you get a 30-day window to ask for reconsideration.
Source: Cal. Code Regs. tit. 10, § 2632.13, "Determination of 'Principally at-Fault' Accidents" — state regulation (primary)
https://www.law.cornell.edu/regulations/california/10-CCR-2632.13
That 51% / $1,000 test exists because California's Proposition 103 framework makes your driving record a mandatory rating factor, then defines narrowly what may go into it.
Source: Cal. Code Regs. tit. 10, § 2632.5, "Rating Factors" — state regulation (primary)
https://www.law.cornell.edu/regulations/california/10-CCR-2632.5
Note what the regulation doesn't say: how many years an at-fault accident may be counted. Section 2632.13 is silent on that, so I'm not going to give you a California lookback period.
Is there a state that publishes an actual surcharge chart?
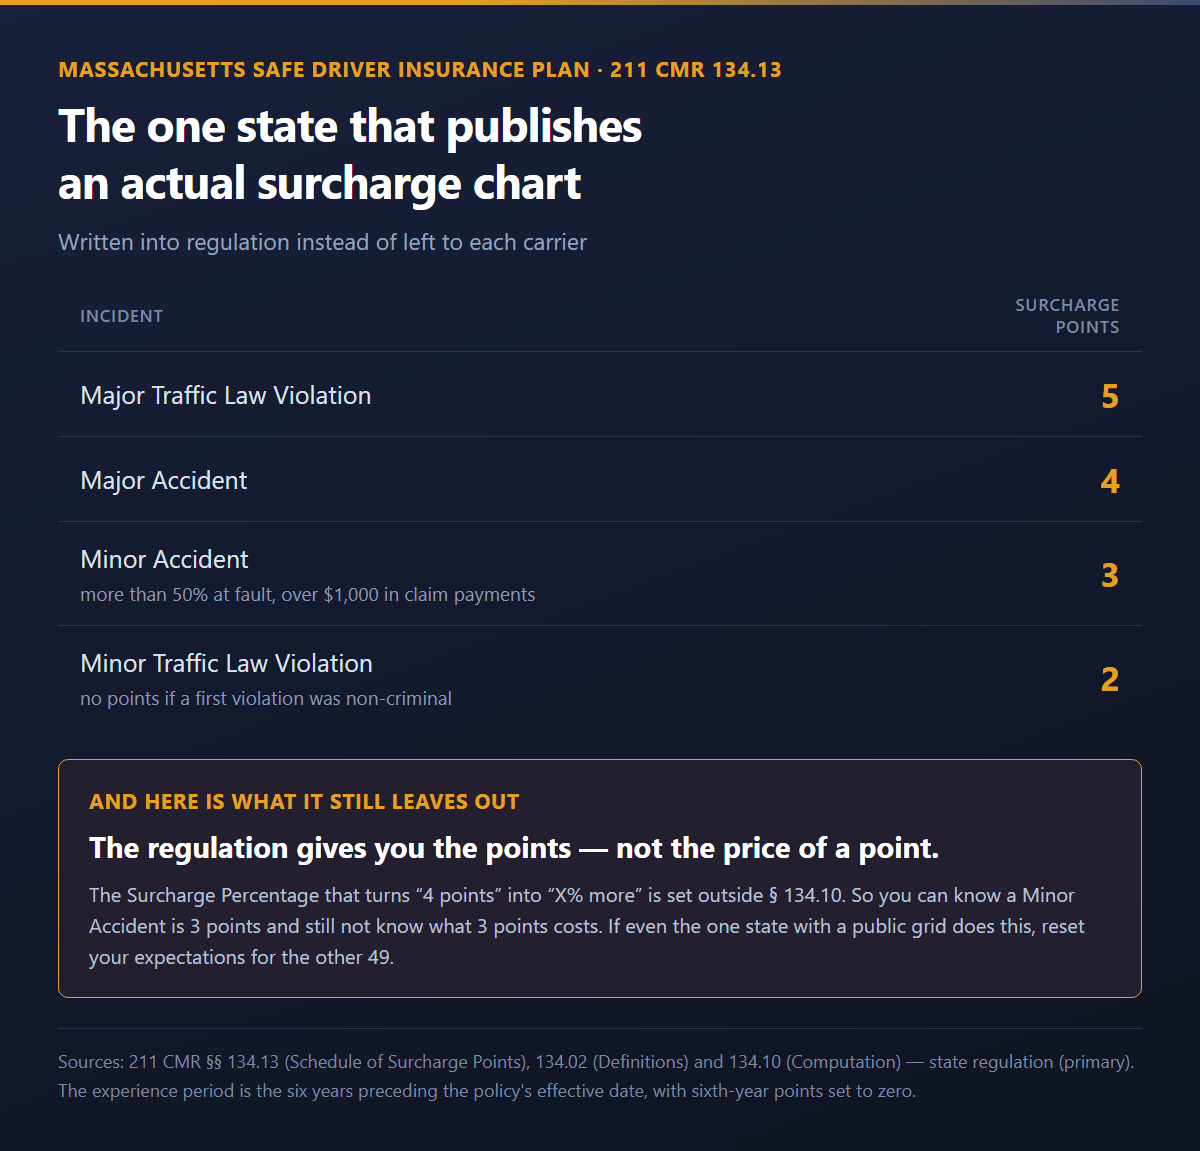
Massachusetts does. It writes the point schedule into regulation instead of leaving it to each carrier — and of the states that set a schedule rather than leaving it to the market, it's the one whose table I could actually read end to end.
Massachusetts codifies its Safe Driver Insurance Plan in 211 CMR 134.00. Here is the grid, verbatim from the regulation:
| Incident | Surcharge points |
|---|---|
| Major Traffic Law Violation | 5 |
| Major Accident | 4 |
| Minor Accident | 3 |
| Minor Traffic Law Violation | 2 |
Comprehensive claims get points only "if four or more Comprehensive Coverage claims totaling $2,000 or more have occurred," excluding acts of God. And a first minor traffic violation gets no points at all if the disposition was non-criminal under M.G.L. c. 90C.
Source: 211 CMR § 134.13, "Schedule of Surcharge Points" — state regulation (primary)
https://www.law.cornell.edu/regulations/massachusetts/211-CMR-134-13
The definitions do the rest of the work. An "At-fault Accident" means the operator was more than 50% at fault, with a claim-payment threshold of over $1,000 for accidents on or after July 1, 2015. The "Policy Experience Period" is the six years immediately preceding the policy's effective date.
Source: 211 CMR § 134.02, "Definitions" — state regulation (primary)
https://www.law.cornell.edu/regulations/massachusetts/211-CMR-134-02
And the arithmetic is spelled out: the surcharge factor is "one plus the product of the total number of SDIP Surcharge Points … and the Surcharge Percentage." Credits mirror it — one minus the Excellent Driver Discount, with credit tiers for going "at least five, but less than six years" and "at least six years" incident-free. Points in the sixth year of the experience period "shall be set at zero."
Source: 211 CMR § 134.10, "Computation of Safe Driver Insurance Plan Surcharges and Credits" — state regulation (primary)
https://www.law.cornell.edu/regulations/massachusetts/211-CMR-134-10
Here's the honest limit of all that. The regulation gives you the formula but not the number. The Surcharge Percentage itself — the value that turns "4 points" into "X% more" — is set outside § 134.10, and I could not retrieve it. The mass.gov SDIP page returned an HTTP 403 error and would not load. So I can tell you a Minor Accident is 3 points; I cannot tell you what 3 points costs.
There's also an escape hatch in the regulation. Under § 134.11, some provisions apply "only for Policies issued during a Fixed-and-established Market," while others apply in both fixed-and-established and competitive markets. In practice: the state-set plan governs a fixed-and-established market, while in a competitive market insurers may use their own Merit Rating Plan. Whether Massachusetts private passenger auto is currently classified as one or the other, I could not confirm.
Source: 211 CMR § 134.11, "Application of Safe Driver Insurance Plan or Merit Rating Plan" — state regulation (primary)
https://www.law.cornell.edu/regulations/massachusetts/211-CMR-134-11
Even the one state that publishes a grid leaves the price of a point off the page. That should reset expectations for the other 49.
How long until your rate goes back to normal?
About five years for the sample driver in the rate data — but three years at some carriers and four at others, which means the cheapest company right after your crash may be the wrong one two years later.
Let's follow one driver the whole way through, instead of jumping between examples. ValuePenguin's curve tracks a 30-year-old man in Pennsylvania who was paying $181 a month before his at-fault accident.
| Time since accident | Monthly rate | Difference vs. before |
|---|---|---|
| Before the accident | $181 | — |
| 6 months | $226 | +$45 |
| 1 year | $226 | +$45 |
| 2 years | $224 | +$43 |
| 3 years | $206 | +$25 |
| 4 years | $205 | +$24 |
| 5 years | $181 | $0 — back to baseline |
Source: ValuePenguin, updated July 17, 2026 — ⚠️ comparison site (difference column is arithmetic on the published rates)
https://www.valuepenguin.com/how-does-accident-affect-my-car-insurance-rates
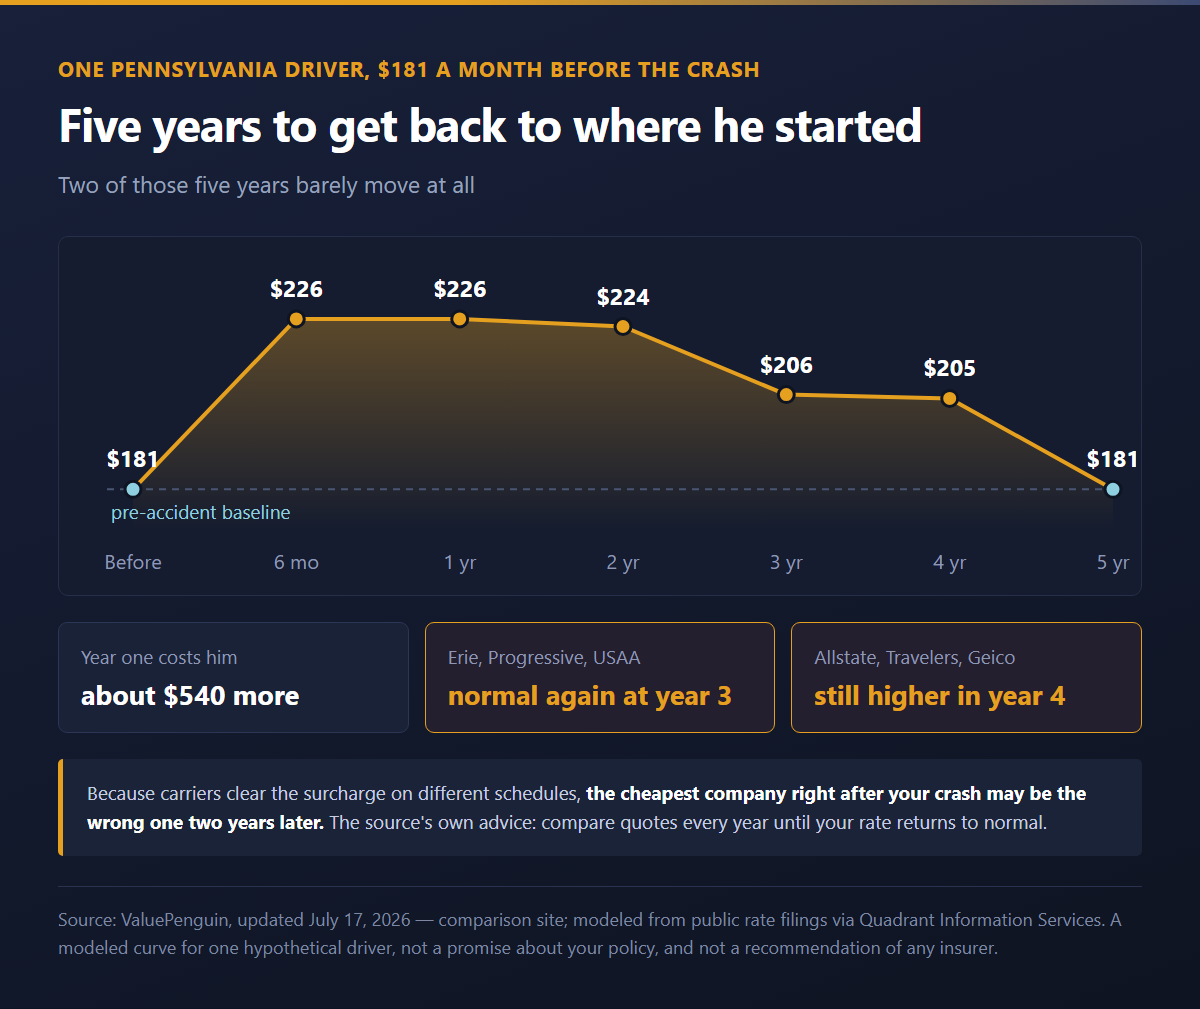
Read it as a story rather than a table.
Year one. He's paying $45 more a month — about $540 more over the year. Nothing he does changes this; the accident is priced in.
Year two. Essentially flat. $224 instead of $226. The surcharge has not started meaningfully burning off.
Year three. The first real relief: $206. Roughly two-fifths of the increase is gone.
Year four. $205. Almost no movement again. Whether he sees relief here depends heavily on his carrier — "at Erie, Progressive and USAA, rates return to normal after just three years. But you'll continue to pay more with Allstate, Travelers and Geico through your fourth year."
Year five. $181. Exactly where he started.
For a national dollar figure on the same event, LendingTree put the three-year cost of one at-fault accident at $3,092.84, on an average increase of $1,030.95 a year — a different model with a different car and a different assumed crash, so read it alongside the Pennsylvania curve rather than on top of it.
The advice that falls out of this is unglamorous but real, and it's the source's own: compare quotes from multiple companies each year until your rate returns to normal. The carriers clear the surcharge on different schedules, so the ranking changes underneath you.
Massachusetts, again, does this by regulation instead of by pricing model: a six-year experience period with sixth-year points set to zero.
Source: 211 CMR §§ 134.02 and 134.10 — state regulation (primary)
https://www.law.cornell.edu/regulations/massachusetts/211-CMR-134-02
Where can you see your own claims record?
In your C.L.U.E. report — and you're entitled to one free copy every 12 months.
Your surcharge is driven by a claims file you can actually read. The Comprehensive Loss Underwriting Exchange, run by LexisNexis, "collects and reports up to seven years of auto insurance claims, as well as seven years of home insurance and personal property claims," used "to help inform pricing and underwriting decisions for the insurance industry."
The CFPB's consumer reporting company list notes: "This company will provide one free report every 12 months if you request it." Request it at 866-897-8126 or consumer.risk.lexisnexis.com. And under the Fair Credit Reporting Act, "companies must conduct – free of charge – a reasonable investigation of your dispute."
Source: Consumer Financial Protection Bureau, consumer reporting companies list — federal agency (primary)
https://www.consumerfinance.gov/consumer-tools/credit-reports-and-scores/consumer-reporting-companies/companies-list/comprehensive-loss-underwriting-exchange/
Washington's insurance regulator describes what's actually inside the file: your name, date of birth and policy number; the date and type of loss; the amount the company paid; and vehicle information for auto claims — generally covering up to seven years. Insurers pull it "when you apply for coverage or request a quote" and use your claims history "to decide if it'll offer you coverage and how much you'll pay."
Source: Washington State Office of the Insurance Commissioner, "CLUE (Comprehensive Loss Underwriting Exchange)" — state insurance regulator (primary)
https://www.insurance.wa.gov/insurance-resources/auto-insurance/credit-and-insurance/clue-comprehensive-loss-underwriting-exchange
If a claim is on there that shouldn't be, or the payout amount is wrong, that error is being priced into every quote you get. Reading the file costs nothing.
Three things these numbers still can't tell you
Even after reading the regulations and both studies, there are gaps. Writing them down beats papering over them.
1. Nobody publishes what a surcharge point costs. Massachusetts publishes the point schedule but not the Surcharge Percentage. Every other state leaves the whole grid inside individual company filings. The result is that the most-quoted answer to this question — "about 45–49%" — comes from comparison sites modeling hypothetical drivers, not from a rate manual anyone can check.
2. The best not-at-fault comparison is nine years old. The Consumer Federation of America study is from February 2017. Its structural finding (legal in most states, carriers behave very differently) is the useful part; its dollar figures should not be treated as current. No newer equivalent turned up.
3. The California accident-forgiveness claim is unverified. You will find it stated all over the internet that accident forgiveness is unavailable in California because of Proposition 103. I found that asserted only in consumer Q&A sites, law-firm blogs and insurance marketing pages — no California Department of Insurance bulletin, regulation or statement confirming it. So I'm not going to repeat it as law. If you're in California and this matters to you, ask your insurer to point at the specific provision.
Two more open items, for completeness: California's regulations don't state how long an at-fault accident may be counted, and I couldn't confirm whether Massachusetts auto is currently a fixed-and-established or a competitive market — which determines whether the published state plan or each carrier's own merit plan governs.
FAQ
Q. How much does car insurance go up after an accident?
A. Two 2026 studies using the same rate-data vendor put the national average at 49% (ValuePenguin, July 2026) and 45.0% (LendingTree, February 2026). The difference comes from modeling a different vehicle and a different crash severity, not from a factual dispute. Both are modeled quotes, not what real customers paid.
Q. Does insurance go up if the accident wasn't your fault?
A. In most states it legally can, and major carriers do it. California, Oklahoma and Washington restrict it. A 2017 Consumer Federation of America study found Progressive surcharged not-at-fault drivers everywhere it was permitted, GEICO and Farmers sometimes added 10% or more, and State Farm never did.
Q. How long does an accident stay on your insurance?
A. In the ValuePenguin rate curve, a Pennsylvania driver's rate returned to its pre-accident level at year five. Carriers differ at the tail: Erie, Progressive and USAA return to normal after three years, while Allstate, Travelers and Geico charge more through the fourth year. Massachusetts uses a six-year experience period with sixth-year points set to zero. Your C.L.U.E. report holds up to seven years of claims.
Q. Does a small claim under $500 raise my rates?
A. Very little in the modeled data — $181 to $184 a month, about 1.7%. A $1,000 claim moves the same driver to $216, about 19.3%. Progressive's small-accident forgiveness covers a first claim under $500 in total damage.
Q. What counts as "at fault" for insurance purposes?
A. It depends on the state. California requires your actions to be at least 51% of the legal cause, plus injury, death, or property damage over $1,000. Massachusetts uses more than 50% at fault, with claim payments over $1,000 for accidents on or after July 1, 2015.
Q. How do I get a copy of my CLUE report?
A. LexisNexis provides one free report every 12 months on request — 866-897-8126 or consumer.risk.lexisnexis.com. Under the Fair Credit Reporting Act, disputes must be investigated free of charge.
Q. Can I look up my insurance company's actual rate filing?
A. Yes, through SERFF Filing Access (filingaccess.serff.com), the NAIC's public portal, at no fee for participating states. Your state insurance department can also route you there. Be warned that filings are written for regulators, not customers.
Q. How much does GEICO raise your rates after an accident?
A. GEICO's own site says rates typically rise "0% to 50% or more" and can stay elevated "three to five years on average." Independent studies that price a standardized driver against GEICO's actual filed rates land on a more specific number: 73% (ValuePenguin) and 73–77% (Forbes Advisor), both using rate data from Quadrant Information Services. The two independent studies agree closely with each other; GEICO's own range is intentionally broader because it has to cover every state and every severity.
Q. Which major insurer raises rates the least after an accident?
A. In both studies that break results out by company, State Farm has the smallest average increase among the major carriers — 14% (ValuePenguin) or 21–22% (Forbes Advisor), depending on whether the accident involved injuries. NJM was lower still at 9%, but NJM only sells insurance in five states.
Q. Why can't I find my own insurer's surcharge number?
A. Because in most states, insurers file their rate manuals with regulators through SERFF, and those filings aren't published as a consumer-facing comparison — you search them one company at a time, and companies can mark rating detail confidential. For large groups like GEICO, the first hurdle is simpler: "GEICO" alone covers roughly 20 to 30 separate legal entities, so a search needs the exact entity name from your declarations page, not the brand name. North Carolina and Massachusetts are exceptions — both set the surcharge by regulation, so it applies the same way no matter which insurer you're with.
What to check before your next renewal
This article doesn't recommend a carrier, and it can't. The data in it shows the ranking changing by state, by claim size, and by how many years have passed since the crash — a company that looks cheap in year one may not be the one that clears your surcharge first.
Three things are worth doing, though, and all three are free.
Pull your C.L.U.E. report. One free copy every 12 months, and it's the file your quotes are actually built on.
https://www.consumerfinance.gov/consumer-tools/credit-reports-and-scores/consumer-reporting-companies/companies-list/comprehensive-loss-underwriting-exchange/
Check whether your state restricts not-at-fault surcharges. If you're in California, Washington or Oklahoma, you have protection most drivers don't — and it only helps if you know to invoke it when a rate increase shows up after someone rear-ended you.
Re-shop every year until your rate comes back down. Not once. Every year. The whole point of the five-year curve is that different companies release the surcharge on different schedules.
The number everyone repeats — "about 49%" — turned out to be an average sitting on top of a 9%-to-73% spread. That spread is the real finding here, and the half of it nobody publishes is what a single surcharge point costs at your own insurer.
Thanks for reading — see you in the next one.
Sources
State regulation / statute (primary)
- 211 CMR § 134.13 – Schedule of Surcharge Points — Cornell Legal Information Institute
- 211 CMR § 134.02 – Definitions — Cornell LII
- 211 CMR § 134.10 – Computation of SDIP Surcharges and Credits — Cornell LII
- 211 CMR § 134.11 – Application of Safe Driver Insurance Plan or Merit Rating Plan — Cornell LII
- Cal. Code Regs. tit. 10, § 2632.5 – Rating Factors — Cornell LII
- Cal. Code Regs. tit. 10, § 2632.13 – Determination of "Principally at-Fault" Accidents — Cornell LII
- Cal. Code Regs. tit. 10, §§ 2632.12–2632.13.1 – Good Driver Discount — Cornell LII
- RCW 46.52.130 – Abstract of driving record — Washington State Legislature
Federal agency (primary)
- LexisNexis C.L.U.E. — consumer reporting companies list — Consumer Financial Protection Bureau
State insurance regulator (primary)
- CLUE (Comprehensive Loss Underwriting Exchange) — Washington State OIC
- Search company filings with SERFF Filing Access — Washington State OIC
- Search the System for Electronic Rates and Forms Filing (SERFF) — Texas Department of Insurance
- Safe Driver Incentive Plan — North Carolina Department of Insurance
- GEICO Group Code: 31 — Illinois Department of Insurance (list of GEICO group legal entities)
Nonprofit consumer advocacy (own primary data)
- Major Insurance Companies Raise Premiums After Not-At-Fault Accidents — Consumer Federation of America, February 13, 2017
Insurer (first-party)
- How much does auto insurance go up after a claim? — GEICO
- How Much Does Insurance Go Up After an Accident? — Progressive
- What Is Accident Forgiveness? — Progressive
⚠️ Insurance comparison sites — lead generation is the business model; rates modeled from public filings via Quadrant Information Services
- How Much Will My Car Insurance Rates Go Up After a Crash in 2026? — ValuePenguin, updated July 17, 2026
- One At-Fault Accident Can Add Thousands to Drivers' Insurance Costs — LendingTree, published February 23, 2026
- How Much Does Car Insurance Go Up After An Accident? — Forbes Advisor, 2026
Secondary source (cross-checked, not read directly)
- New Jersey Surcharge — background on the NJ Merit Rating Program, cross-checked against multiple New Jersey traffic-law sites; the underlying statute (N.J.S.A. 17:29A-35) was not read directly for this article
This article does not recommend, endorse or solicit any insurance company or policy. Company-level figures are cited only as evidence that pricing for the same accident varies. Your own premium depends on factors this article does not model.


Comments
Post a Comment