Are Lucky Lottery Stores Real? We Checked 30,000 in Texas
Search "luckiest lottery store near me" and you'll get real answers. Some stores really do sell winner after winner.
Last updated: 18 September 2026 · Figures and rules in this post are current as of this date.
But they're not lucky. They're busy.
We didn't take a lottery blogger's word for that. Texas publishes two datasets that most states don't pair up: monthly lottery sales for every retailer, and a list of prize claims tagged with the store that sold the ticket. So we pulled both, matched them store by store — 30,054 retailers, six years of scratch-ticket sales, every prize of $1,000 or more — and calculated the number nobody else seems to have published: wins per dollar sold, store by store.
Is There Really Such a Thing as a Lucky Lottery Store?
Somewhere on I-35 in Austin, Texas, sits a gas station and convenience store called Winners Corner.
Since fiscal year 2021, it has sold $94.0 million worth of Texas Lottery scratch tickets — more than any other retailer in the state. In that same window, its customers cashed in 2,394 tickets worth $1,000 or more. That's also more than any other store in Texas.
Rank the state's 30,054 lottery retailers by big wins, and rank them separately by total scratch-ticket sales. The number-one store on both lists is the same store.
Source: Texas Open Data Portal, "Texas Lottery Sales by Fiscal Month/Year, Game and Retailer" (dataset beka-uwfq) and "Winners List of Texas Lottery Prizes" (dataset 54pj-3dxy), matched by retailer number, fiscal years 2021–2026.
Across all 30,054 stores, the correlation between total sales and total $1,000+ wins is 0.889.
That's a strong enough relationship that it usually means one thing is driving the other.
Sell more tickets, and — with no supernatural help required — you sell more winners.
If the story stopped there, this would be a short, slightly boring piece: no such thing as a lucky store, only a busy one. Go home.
It doesn't stop there.
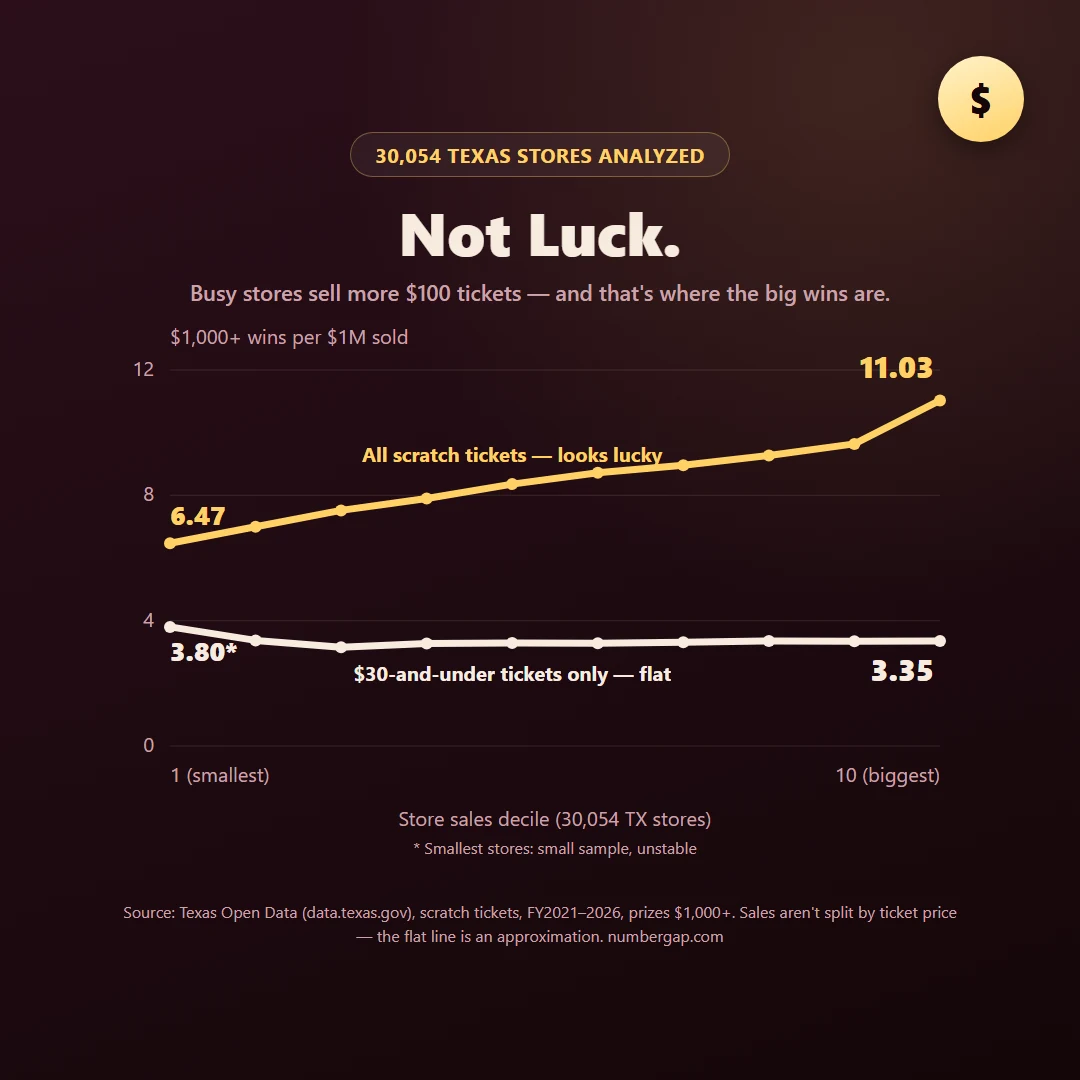
We split all 30,054 stores into ten equal groups by total sales, smallest to biggest, and counted wins per $1 million sold inside each group. If size were the whole explanation, a small store and a big store should win at roughly the same rate per dollar — a big store just does it more times because it sells more dollars.
That's not what the data shows.
The smallest-selling tenth of stores: 6.47 big wins per $1 million sold.
The biggest-selling tenth: 11.03.
Winners Corner itself sells at a rate of 25.48 wins per $1 million — more than double even the average for stores its own size.
For a moment, that looks like real evidence of a lucky store, not just a busy one.
Why Do the Busiest Stores Win More Per Dollar?
We went back into the win data and sorted all 387,313 prizes of $1,000 or more by the price of the ticket that won them.
$1 tickets accounted for 469 of those wins across six years. $2 tickets: 4,410. The number climbs steadily with ticket price, all the way up to $100 tickets, which produced 191,271 of the 387,313 wins — close to half of every $1,000-plus prize paid out in Texas since 2020.
Source: Texas Open Data Portal, "Winners List of Texas Lottery Prizes" (dataset 54pj-3dxy), grouped by instant_price_point.
Half of all big scratch-ticket wins come from a single price of ticket.
The bigger a store's total sales, the more of that $100 ticket it tends to sell. Across the ten sales deciles, $100 tickets make up 29.2% of a small store's big wins, 45.4% at the midpoint, and 52.2% at the top decile. Among the state's ten single biggest winners by ticket count, $100 tickets account for 71.6% of their wins on average.
At Winners Corner specifically, $100 tickets are 90% of its winning tickets.
So we ran one more test. Strip out every $50 and $100 ticket, and count only wins from tickets priced $30 or under, still measured per $1 million in total sales.
The gap that looked so dramatic a minute ago collapses to almost nothing: 3.37, 3.15, 3.27, 3.29, 3.28, 3.31, 3.35, 3.34, 3.35 — decile after decile, essentially flat, from the second-smallest group of stores to the very biggest. (The smallest decile alone runs a bit higher, 3.80, but that group also has the least total sales, which makes its rate the noisiest to calculate.)
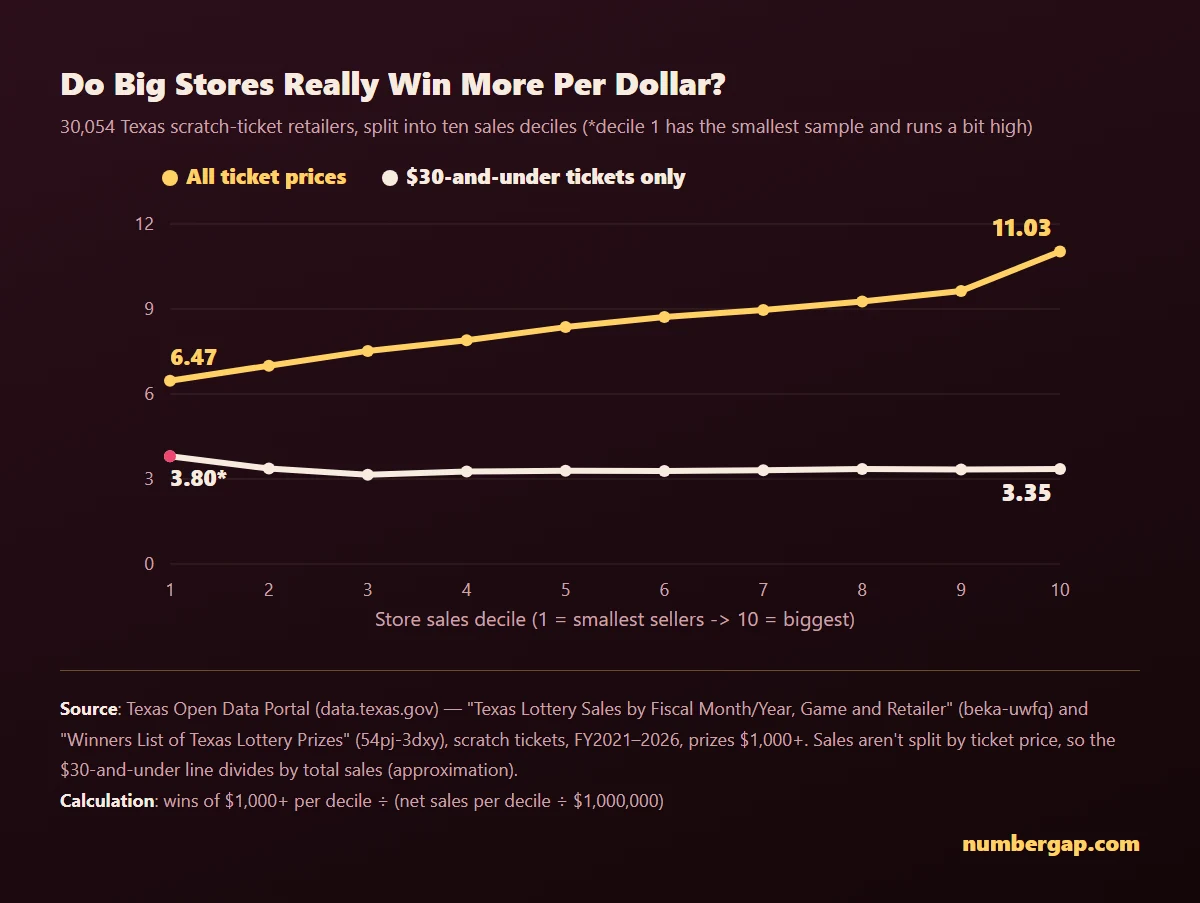
Take away the $50 and $100 tickets, and big stores stop looking lucky at all.
A few things keep this from being an exact, final number rather than a strong signal. Texas's sales data isn't broken down by ticket price — only the win data is — so dividing $30-and-under wins by a store's total sales is an approximation, not a precise per-product win rate. We only counted prizes of $1,000 or more, because those are paid out directly by the Texas Lottery Commission and the record is complete; smaller prizes are cashed at the counter and aren't reliably tracked back to a store. This covers scratch tickets only, in Texas only, for prizes claimed between September 2020 and August 2026 — and a claim date isn't the same as a purchase date, since a winning ticket can sit in a drawer for months before someone cashes it. And a correlation of 0.889 doesn't prove causation by itself. But combined with the fact that lottery odds are fixed at the printing press or the drawing — never at the cash register — it's hard to construct a competing explanation.
Winners Corner isn't accused of anything here, and neither is any other store this piece names. The winner records we pulled include individual names and hometowns; we didn't use any of it, and we only aggregated results at the store level. What the public data shows is a busy, successful retailer that happens to sell a lot of $100 tickets. Nothing in it suggests otherwise.
Colorado runs a public "Winning Stores" search tool that lists wins by location, and it's a genuinely useful transparency effort — but it doesn't publish sales, so the ratio still can't be calculated there. Texas is the rare state that makes both halves public.
Anyone can pull the same two datasets from data.texas.gov and run this themselves. We looked for a public analysis that pairs a state's retailer-level sales data with its retailer-level win data this way, and didn't find one — if it exists elsewhere, we missed it.
Does Buying at a "Lucky" Store Actually Help?
Two separate teams of economists have measured what happens after a store sells a winner. Neither one is asking whether the store's odds are better. Both are asking whether people believe they are — and whether that belief changes what they buy.
Jonathan Guryan and Melissa Kearney tracked Texas Lotto retailer sales week by week. In the seven days right after a store sold a jackpot-winning ticket, sales at that same store jumped 12 to 38%, and bigger jackpots produced bigger jumps. Some of that increase held on for as long as 40 weeks. Their paper, "Gambling at Lucky Stores: Empirical Evidence from State Lottery Sales," ran in the American Economic Review in 2008. (Their data comes from Texas Lotto, a numbers-drawing game — a different product than the scratch tickets in our own analysis above, but the same underlying pattern.)
Source: Guryan & Kearney, "Gambling at Lucky Stores: Empirical Evidence from State Lottery Sales," American Economic Review 98(1): 458–73, 2008.
A separate team — Jaimie Lien, Jiayuan Huang, and Zhengjie Zheng — found the same pattern using Massachusetts lottery data instead, a different state, a different game, a different dataset.
Both studies agree on what happens. They disagree on why.
Guryan and Kearney's own abstract rules out the "hot hand" explanation — the idea that a store on a streak will keep producing winners. They point instead to something closer to habit: people start buying from a store out of loyalty to a good memory, and the habit outlasts any reason for it.
Lien, Huang, and Zheng land somewhere else: representativeness bias, the same reasoning error behind the "law of small numbers." Customers treat a recent win as evidence about the store's future odds, even though an independent, random drawing has no memory of last week.
The economists agree that people flock to a store after it sells a winner. They just don't agree on the psychology behind it.
Put both papers next to the Texas numbers above and the loop closes: a store sells a winner. Research says people show up because of it. More people buying means more tickets sold — and, on our own data, more of everything that comes with more tickets sold, including more winners on the pricier tickets that make the local news. The store looks lucky again. More people show up.
The odds themselves never move to make any of this true. Powerball's jackpot odds are 1 in 292,201,338, a matrix that's been fixed since October 2015. Mega Millions changed its own rules on April 5, 2025: jackpot odds went from 1 in 302,575,350 under the old $2 game to 1 in 290,472,336 under the new $5 game. Neither number depends on which gas station sells the ticket.
Harvard statistician Dr. Mark Glickman put it plainly to CBS Pittsburgh: buying at a store that previously sold a winner "doesn't give you any particular advantage, but it also doesn't give you any disadvantage, either." The Ohio Lottery's own consumer material says the same thing in fewer words: "every ticket has the same odds no matter where you buy it."
Source: CBS News Pittsburgh, "Luck of the Lottery: What are the odds of the same store selling a second winning ticket?"; Ohio Lottery, "Know the Odds."
Is Quick Pick Better Than Picking Your Own Numbers?
Roughly 70 to 80% of Powerball and Mega Millions tickets sold in the US are Quick Picks — numbers a terminal generates, not numbers a player chooses. Oregon, Minnesota, and Wisconsin lottery officials all put the figure in that range for their own states.
Source: Oregon Lottery, Minnesota Lottery, and Wisconsin Lottery, official FAQ pages.
About 80% of Powerball jackpot winners used Quick Pick, according to the Multi-State Lottery Association, which runs the game.
That's not because a computer picks better numbers. It's because Quick Pick tickets are roughly 70 to 80% of everything sold — so they make up roughly 70 to 80% of what wins, too. Play rate and win rate line up almost exactly, which is precisely what a genuinely random drawing should produce.
It's the same store story, run through a numbers machine instead of a cash register.
Does South Korea Have Lucky Lottery Stores Too?
South Korea has its own version of this belief — 명당, spots that gain a reputation for producing repeat winners. What Korea doesn't have is a way to check it the way Texas lets you check it: the national lottery operator publishes which store sold a winning ticket, and whether it was a Quick Pick, but never how many tickets that store actually sold. Without the sales side, the ratio can't be calculated.
What Korea does have is a single, striking drawing.
On July 13, 2024, Korea's Lotto 6/45 paid first-prize winnings to 63 people at once — the most in the game's history, each collecting about ₩419.93 million before tax. Eleven of those 63 winning tickets were Quick Pick. Fifty-two were numbers the player chose personally.
In a typical drawing, roughly 64% of Korean lottery winners hold Quick Pick tickets. In this one drawing, it flipped: about 83% had picked their own numbers.
When people choose their own numbers, they don't choose randomly. They cluster.
Enough players independently land on similar-looking combinations — birthdays, sequences, patterns people find memorable — that when one of those combinations happens to get drawn, a disproportionate pile of tickets wins at once. It's the store mechanism from Texas, translated into six numbers instead of a storefront: concentration in produces concentration of wins out.
Officials at Korea's national lottery operator, 동행복권, addressed suspicion of manipulation directly, saying certain numbers are simply popular with players and this was that popularity meeting a random draw. Seoul National University's Institute of Statistics reviewed the drawing and concluded the equal probability of the draw itself wasn't violated, and that a multiple-winner outcome like this one falls well within statistically expected range. In November 2024, the lottery operator went a step further and held a nationally broadcast drawing with 100 invited citizens present, an unusually public step to address ongoing doubts.
Source: 동행복권 official response; 서울대학교 통계연구소 검증; 부산일보, 한국경제, November 23, 2024 broadcast-drawing coverage.
So Is There Such a Thing as a Lucky Lottery Store?
Not in the way the phrase suggests. No store, gas station, or corner shop has better odds than any other. The numbers are drawn independently of the point of sale, in Texas, in Korea, everywhere.
A lucky store isn't lucky. It's where people go — and the reputation sends more of them.
That loop is the whole story. It shows up in Texas's scratch-ticket data as a store that sells more tickets and more of the pricey ones. It shows up in academic research as a documented sales bump after a big win. It shows up in Korea as a cluster of self-picked numbers landing on one lucky drawing. Different countries, different games, same shape.
If you want to check any of it yourself, the two Texas datasets are public, free, and don't require an account — just a spreadsheet and some patience.
What This Piece Could Not Verify
- The exact win rate by individual ticket price. Texas's sales data isn't broken out by price point, so our $30-and-under comparison divides by each store's total sales — a strong approximation, not a precise per-product number.
- Which psychological mechanism is correct. Guryan and Kearney's research points to habit formation; Lien, Huang, and Zheng's points to representativeness bias. Both are peer-reviewed, and they disagree with each other.
- Whether any employee, owner, or customer at Winners Corner or any other store named here did anything unusual. Nothing in Texas's public data suggests it, and this piece makes no such claim.
- Whether any other state publishes the combined sales-and-wins data needed to run this same analysis. We didn't find one in this research.
- One claim we came across, that more than 40,000 people bought the exact same number combination in Korea's Draw 1128. We could not confirm this, and it doesn't appear to be internally consistent — if that combination had actually been drawn, it would have produced roughly 40,000 first-prize winners, not 63.
Frequently Asked Questions
Q. Is there really such a thing as a lucky lottery store?
A. Not in the sense of better odds — every ticket has identical odds no matter where it's sold. What some stores really have is more sales, and our analysis of 30,054 Texas retailers found that the biggest sellers also sell a higher share of $100 tickets, which produce close to half of all $1,000-plus prizes.
Q. Which store has sold the most winning lottery tickets in Texas?
A. Based on Texas's own public sales and prize data, Winners Corner in Austin leads the state in both categories — 2,394 wins of $1,000 or more since fiscal year 2021, and $94.0 million in total scratch-ticket sales, more than any other retailer.
Q. Do lottery stores really have better odds?
A. No state sets different odds by location. Odds are fixed when a scratch-ticket batch is printed or when a drawing happens, not by the retailer that sells the ticket.
Q. Why do some stores sell so many winning tickets?
A. Mostly sales volume, plus what they sell. Once we removed the pricier $50 and $100 scratch tickets from the Texas data, win rates per dollar sold came out almost flat across every store size.
Q. Is Quick Pick better than picking your own lottery numbers?
A. No. Roughly 70–80% of Powerball and Mega Millions tickets sold are Quick Picks, and about 80% of Powerball jackpot winners used Quick Pick — because that's close to the share of all tickets sold, not because a computer picks better numbers.
Q. What are the odds of winning Mega Millions or Powerball?
A. Powerball's jackpot odds are 1 in 292,201,338. Mega Millions changed its rules on April 5, 2025: odds went from 1 in 302,575,350 under the old $2 game to 1 in 290,472,336 under the new $5 game.
Q. Does South Korea have lucky lottery stores too?
A. The culture exists, but South Korea doesn't publish store-level sales data, so the Texas-style analysis can't be run there. The closest evidence is Draw 1128 in July 2024, when 63 people won first prize at once and 83% had picked their own numbers, versus a typical 64% Quick Pick share.
Q. Where do "luckiest lottery store" rankings come from, and can I trust them?
A. Rankings cited in the news, often sourced to the gambling media site casino.org, typically rank stores by total cumulative jackpot dollars won — not by win rate adjusted for how many tickets a store actually sells. A store open for decades selling thousands of tickets a day will out-accumulate a smaller store purely on volume.
Q. Can I check the Texas lottery data myself?
A. Yes. Texas publishes both datasets on data.texas.gov: "Texas Lottery Sales by Fiscal Month/Year, Game and Retailer" (dataset beka-uwfq) and "Winners List of Texas Lottery Prizes" (dataset 54pj-3dxy), which can be matched by retailer number.
Q. Does buying at a store that sold a past winner improve my odds?
A. No. Harvard statistician Dr. Mark Glickman told CBS Pittsburgh that it "doesn't give you any particular advantage, but it also doesn't give you any disadvantage, either."
Sources
- Texas Open Data Portal, "Texas Lottery Sales by Fiscal Month/Year, Game and Retailer" (dataset beka-uwfq), data.texas.gov
- Texas Open Data Portal, "Winners List of Texas Lottery Prizes" (dataset 54pj-3dxy), data.texas.gov
- Guryan, J. & Kearney, M.S., "Gambling at Lucky Stores: Empirical Evidence from State Lottery Sales," American Economic Review 98(1): 458–73, 2008 (aeaweb.org)
- Lien, J.W., Huang, J. & Zheng, Z., "Representativeness Biases and Lucky Store Effects" (jaimielien.weebly.com)
- CBS News Pittsburgh, "Luck of the Lottery: What are the odds of the same store selling a second winning ticket?" (Dr. Mark Glickman, Harvard University Department of Statistics)
- Ohio Lottery, "Know the Odds," ohiolottery.com
- Oregon Lottery, Minnesota Lottery, Wisconsin Lottery — official Quick Pick share FAQ pages
- Multi-State Lottery Association Powerball Quick Pick statistic, as reported by NBC Connecticut
- Powerball.com, official odds pages
- Illinois Lottery, Maryland Lottery, Wisconsin Lottery — official Mega Millions game-change pages, 2025
- Colorado Lottery, "Winning Stores" search tool, coloradolottery.com
- NBC Chicago, reporting on casino.org's state "luckiest store" rankings
- 동행복권, official response to Draw 1128 coverage
- 서울대학교 통계연구소, verification of Lotto 6/45 Draw 1128
- 부산일보, 한국경제 — November 23, 2024 coverage of the nationally broadcast 100-citizen lottery drawing
- National Council on Problem Gambling, ncpgambling.org
This piece is about lottery-retailer sales data, statistics, and myths about "lucky" stores and numbers. It is not an endorsement of playing the lottery. If gambling stops being fun, help is available 24/7 at 1-800-GAMBLER.


Comments
Post a Comment