Who Actually Gets Unemployment Benefits? 26.75% in 2024
Search "who qualifies for unemployment benefits" and you get rules: base period, minimum earnings, good cause. Almost nobody tells you how many people those rules actually let through.
Last updated: 21 October 2026 · Figures and rules in this post are current as of this date.
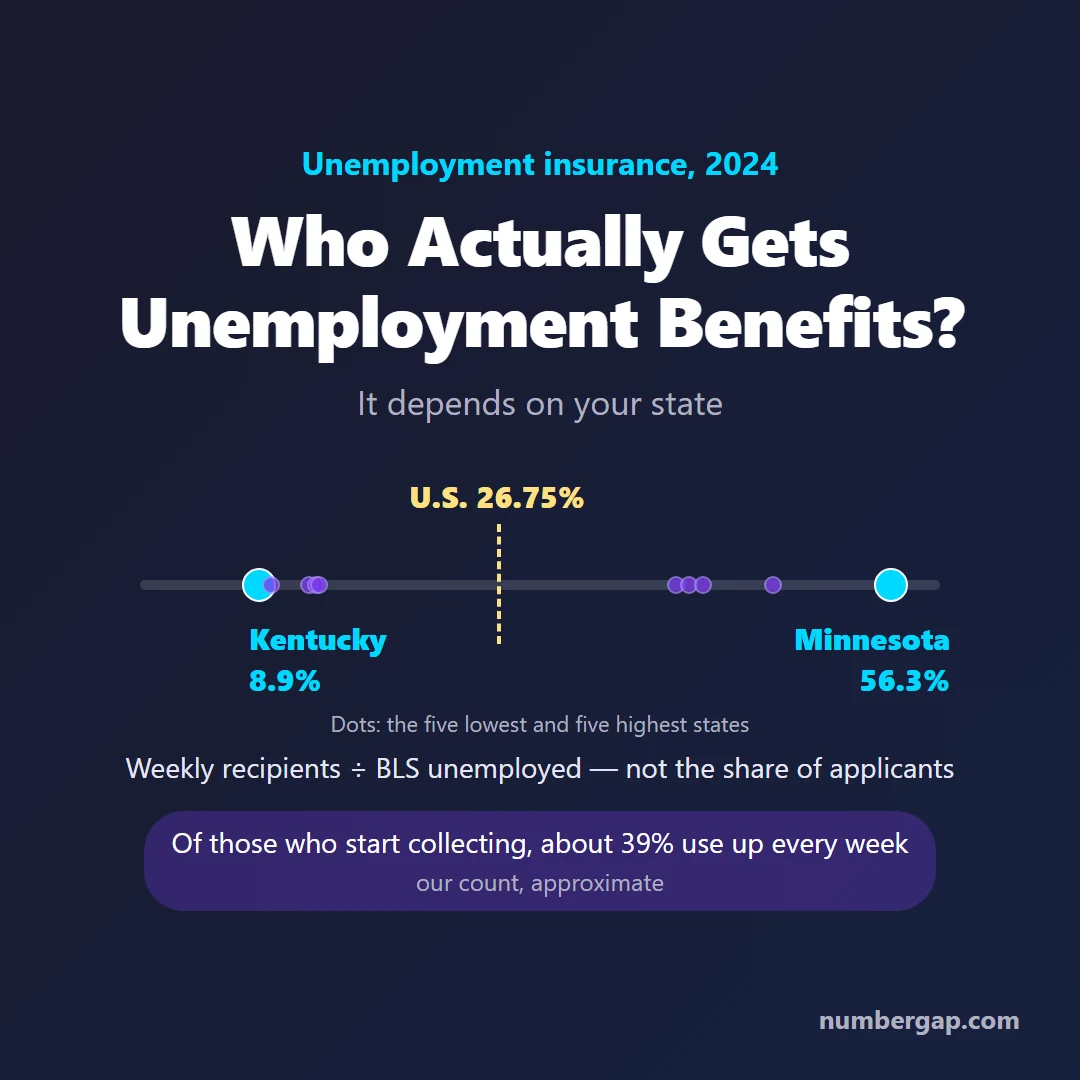
The Labor Department does. For 2024, it put the national figure at 26.75%.
That number is easy to misread. It is not "one in four people who apply." It is the average number of people collecting regular state benefits in a given week, divided by the number of unemployed people the Bureau of Labor Statistics counts. Two different counts, one ratio.
By state, the ratio runs from 8.9% in Kentucky to 56.3% in Minnesota.
So we asked the next question. Of the people who do start collecting, how many use up every week they are entitled to? We counted it from the Labor Department's raw payment files.
About two in five. Our count is 38.8%.
Read this first. Whether you qualify, and for how many weeks, is decided by your state's unemployment agency (the state labor department or workforce agency) from your own wage records and the facts of your job loss. This post explains how the rules and the numbers work. It cannot tell you how your claim will come out. File a claim with your state to find out.
Last updated: October 21, 2026. Figures are as of that date. "DOL's July 2026 table" means the Labor Department's "Significant Provisions of State Unemployment Insurance Laws," effective July 1, 2026, which DOL describes as not an official interpretation of state law.
Who Qualifies for Unemployment Benefits? Three Gates, Set by Your State
Your state decides. Federal law sets broad requirements, and there is no national minimum for how long you must have worked or how many weeks you can collect.
Source: U.S. Department of Labor, Office of Unemployment Insurance, "State Unemployment Insurance Benefits" fact sheet (page updated September 2026) — agency guidance. It says eligibility, benefit amounts and the length of time benefits are available "are determined by the State law under which unemployment insurance claims are established."
https://oui.doleta.gov/unemploy/uifactsheet.asp
The Congressional Research Service counts 53 separate programs: the 50 states, D.C., Puerto Rico and the Virgin Islands. To qualify, a worker generally needs qualifying wages in covered work over a base period, has to have lost the job through no fault of their own, and has to be able, available and looking for work.
Source: Congressional Research Service, R48447, "Unemployment Insurance: Legislative Issues in the 119th Congress," March 6, 2025 — congressional agency report
https://www.congress.gov/crs_external_products/R/PDF/R48447/R48447.1.pdf
In practice that is three gates, each written by a different part of your state's law.
- Money. Did you earn enough, or work enough hours, in the base period?
- Separation. Why did the job end?
- Ongoing eligibility. Are you able to work, available for work, and searching, week after week?
There is also a threshold question before any of them: was the work "covered employment" at all. That is where gig workers run into trouble, and we get to it below.
Why can recent work be invisible?
Because of the base period. Almost every state uses "the first four of the last five completed calendar quarters" before you file. The Labor Department notes this creates "a lag of up to six months" between the end of that window and the day you file.
Many states let you use an alternative base period, the last four completed quarters, if you fail the regular test.
Source: DOL, "Comparison of State Unemployment Insurance Laws 2023," Ch. 3 — federal agency compilation. It is the 2023 edition, the newest DOL has posted, so confirm any single state's rule with that state.
https://oui.doleta.gov/unemploy/comparison/2020-2029/comparison2023.asp
How much work does each state require?
States use four kinds of tests: a multiple of your best quarter's wages, a multiple of your weekly benefit, a flat dollar amount, or weeks or hours worked. Here is how different the gate looks in seven states.
| State | What DOL's July 2026 table says you need in the base period |
|---|---|
| Washington | 680 hours of work (no dollar minimum listed) |
| Oregon | Wages over $1,000 and over 1.5x high-quarter wages, or 500 hours |
| Louisiana | $1,200 in base-period wages, wages in 2 quarters, and 1.5x high-quarter wages |
| Florida | 1.5x high-quarter wages, at least $3,400, wages in 2 quarters |
| Utah | $5,500 in the base period and 1.5x high-quarter wages |
| Massachusetts | 30x the weekly benefit and at least $6,300 (the highest flat minimum in the table) |
| New Jersey | 20 weeks of work at $310 a week or more, or $15,500 in the base year (2026 figures from the state) |
Source: DOL, "Significant Provisions of State Unemployment Insurance Laws, Effective July 2026" — federal agency table, "not an official interpretation of state UI laws." New Jersey row: NJ Department of Labor and Workforce Development press release, December 29, 2025.
https://oui.doleta.gov/unemploy/content/sigpros/2020-2029/July2026.pdf
Do not read the table as a ranking of generosity. DOL itself warns that states with a uniform duration "are not necessarily 'more generous' than the other states because many of these states have comparatively high minimum wage thresholds to qualify."
How often does the money gate actually block people?
We checked. DOL's ETA 218 file records every monetary determination: whether a claimant's wage record was enough to open a claim.
In 2025, states made 8,261,186 monetary determinations. 987,947 of them, 12.0%, found "insufficient wage credits." That share was 14.1% in 2023 and 12.7% in 2024.
By state it ranged from Connecticut at 2.6% to D.C. at 22.6% and Alabama at 22.2%.
Those are decisions on claims that were filed. They cannot show the larger group that never files because it assumes it won't qualify, which is the subject of a later section.
Source: Computed by us from DOL ETA 218 "Benefit Rights and Experience," calendar years 2023-2025, 50 states and D.C. (Puerto Rico and the Virgin Islands excluded). Counts are determinations, not people.
https://oui.doleta.gov/unemploy/csv/ar218.csv
How Long Does Unemployment Last? Anywhere From 12 to 30 Weeks
Most people hear "26 weeks." That is the ceiling in most states, not what everyone gets.
DOL's July 2026 table sorts states into three tiers.
- Uniform 26 weeks for everyone who qualifies: Connecticut, D.C., Hawaii, Illinois, Maryland, New Hampshire, New York and West Virginia (plus Puerto Rico). Indiana also lists 26.
- A 26-week ceiling that can be lower if your earnings were concentrated in one quarter. This covers most other states.
- Below 26 weeks. By our reading, about 15 states: Arkansas, Florida and North Carolina at 12; Louisiana and Tennessee at 12 to 20 depending on the unemployment rate; Alabama and Georgia at 14; Kansas, Iowa, Kentucky and Oklahoma at 16 or thereabouts; Missouri and South Carolina at 20; Arizona and Montana at 24.
One state, Massachusetts, can go above 26. DOL lists 10 to 30 weeks. The 30-week figure applies when the 12-month unemployment rate in any of the state's metropolitan areas exceeds 5.1%. That was triggered in April 2025. We did not find an official statement that it is still on in October 2026.
Source: DOL July 2026 table (link above), column "Benefit Weeks Payable" and the "Calculation of Maximum Benefit Amount" cell. DOL's footnote: weeks depend on base-period wages "and the state's unemployment rate." Massachusetts trigger: Center on Budget and Policy Priorities summary, May 4, 2026 (secondary; seen only through search summaries).
How many states pay less than 26 weeks?
Depends who is counting. The Center on Budget and Policy Priorities (May 2026) says 16. The National Employment Law Project counted 14 in 2023. Our reading of the July 2026 table gives 15. The gap comes from how rate-indexed states and Georgia, Louisiana and Tennessee are counted. We use "about 15."
Some numbers in circulation are simply stale. Newsweek (March 3, 2026) lists Arkansas at 16 weeks and Kentucky at 12. Arkansas cut its maximum from 16 to 12 weeks for claims starting January 1, 2024 (Act 196 of 2023). Kentucky's own agency page says 16 to 24 weeks, indexed to the unemployment rate since July 1, 2023. Many commercial guides still say Montana pays 28 weeks. DOL's table says 8 to 24.
What do the short-duration states actually say?
They don't always say the same thing twice.
Florida's statute is clear. For claims filed in a calendar year, benefits last 12 weeks if the state's average unemployment rate is at or below 5 percent, one more week for each 0.5-point increment above that, and a maximum of 23 weeks at 10.5 percent or higher. Total benefits are also capped at 25 percent of base-period wages, "not to exceed $6,325," so low earners can get fewer than 12 weeks. That is why DOL prints "9-12" for Florida.
Source: Florida Statutes 443.111 (2026 text) — state statute
https://www.leg.state.fl.us/Statutes/index.cfm?App_mode=Display_Statute&Search_String=&URL=0400-0499/0443/Sections/0443.111.html
North Carolina's agency FAQ contains two sentences that sit awkwardly together. One paragraph says benefits run "12 to 20 weeks" depending on the state's rate. The "Benefit Exhaustion" paragraph on the same page says "the maximum number of weeks you can get benefits is 12 weeks." The page does not explain how the two fit. Current practice is 12.
Source: North Carolina Division of Employment Security, Unemployment Benefits FAQs — state agency guidance
https://www.des.nc.gov/need-help/faqs/ui
Michigan went the other way. A 2024 law raised the maximum from 20 to 26 weeks for claims filed on or after April 2, 2025.
Source: Michigan Department of Labor and Economic Opportunity notice, March 27, 2025 — state agency
https://michigan.gov/leo/news/2025/03/27/increased-unemployment-benefits-and-added-weeks-go-into-effect-april-2
What do new claimants actually get assigned?
This is the clearest single number we found against the "six months of benefits" assumption.
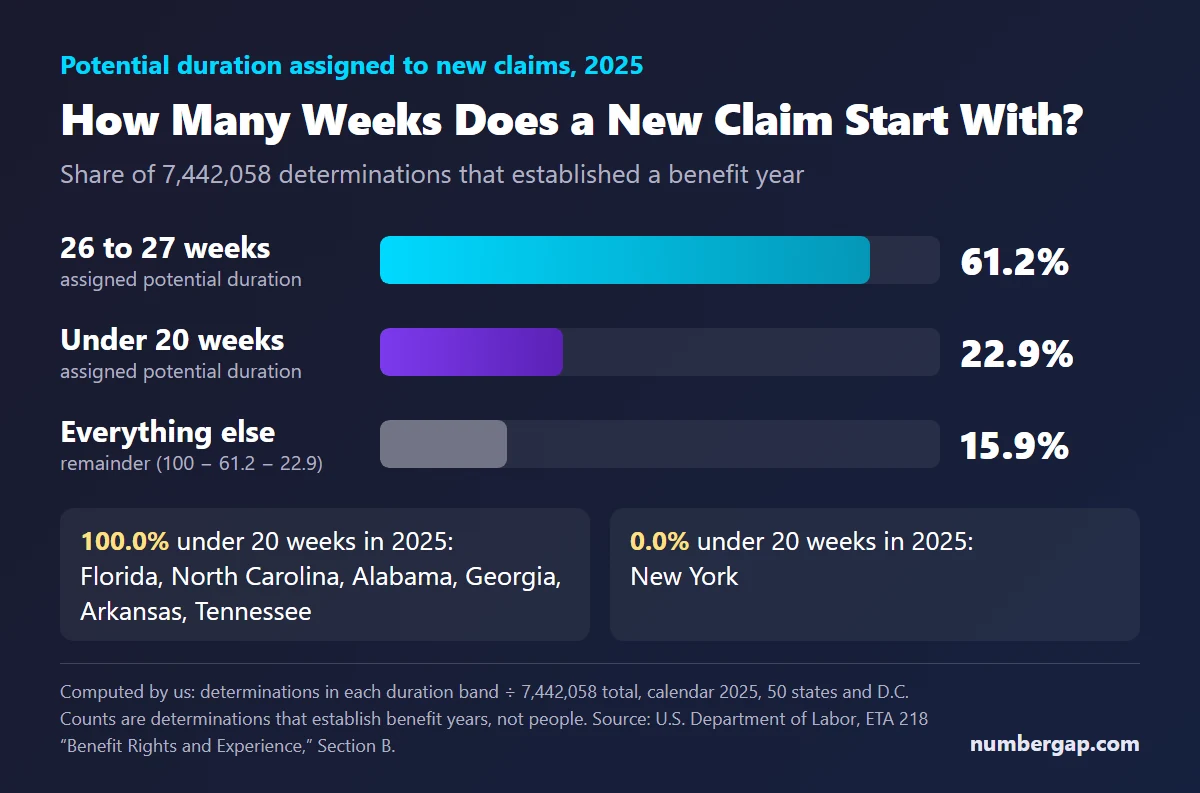
DOL's ETA 218 file records the potential duration assigned to each new benefit year. In 2025 there were 7,442,058 of them. 61.2% were assigned 26 to 27 weeks. 22.9% were assigned under 20 weeks.
Roughly one in five new claims starts with an entitlement shorter than 20 weeks. In Florida, North Carolina, Alabama, Georgia, Arkansas and Tennessee, essentially every new claim does (100.0% in 2025). In New York, 0.0%.
Source: Computed by us from DOL ETA 218, Section B, "Potential duration for determinations establishing benefit years," calendar 2025, 50 states and D.C. Counts are determinations that establish benefit years, not people.
https://oui.doleta.gov/unemploy/csv/ar218.csv
How long people actually collect is shorter still. DOL's data dashboard shows an average duration of 15.67 weeks for the 12 months ending September 30, 2026. That is weeks paid per first payment, not the legal maximum.
Source: DOL UI Data Dashboard (updated September 11, 2026) — federal agency statistic
https://oui.doleta.gov/unemploy/DataDashboard.asp
What about the dollar amounts?
We covered them in a separate post. The short version: the average weekly benefit paid was $497.15 over those same 12 months, while the statutory maximum runs from $235 in Mississippi to $1,208 in Washington. A maximum is a cap, not a typical payment.
Related: How Much Does Unemployment Pay? Your State Decides Most of It
What Percent of Unemployed People Actually Get Unemployment Benefits?
About one in four. DOL's number is 26.75% for 2024, and the definition matters more than the number.
DOL's own wording: "The Recipiency Rate represents the insured unemployed in regular programs as a percentage of the total unemployed."
Source: DOL ETA Chartbook, "Recipiency Rates, By State" (page updated September 11, 2026) — federal agency statistic
https://oui.doleta.gov/unemploy/Chartbook/a13.asp
The top of that fraction is a weekly count of people collecting benefits. The bottom is the BLS's count of unemployed people, whether or not they ever applied. It is a ratio of one snapshot to another. It is not the share of laid-off workers who ever receive a payment, and it is not the share of applicants who are paid.
Can the number be reproduced?
We tried, because we did not want to repeat a figure we hadn't checked.
For each state we took continued weeks claimed in the year from DOL's ETA 5159 file, divided by 52 to get an average weekly count, and divided that by the 12-month average of unemployed people from BLS state data. Then we compared with the Chartbook for all 51 jurisdictions in 2024.
The largest difference was 0.0 percentage points.
For 2024, every source agrees. The national value is 26.75% (DOL), 27% (NELP quoting DOL) and 26.8% (our version). For 2023 DOL shows 28.47%.
Why does 2025 have three different answers?
Because we got three.
| Source | 2025 national recipiency |
|---|---|
| DOL Chartbook (as displayed October 21, 2026) | 28.07% |
| Cleveland Fed (July 1, 2026) | 26.5% |
| Our recomputation | 25.8% |
We can offer reasons, not a verdict. BLS state data for October 2025 are missing ("Data unavailable due to the 2025 lapse in appropriations"), BLS revises state data each March, and the Chartbook page was refreshed on September 11, 2026, after the Cleveland Fed piece. We did not find DOL documentation of how the Chartbook handled October 2025.
So we build on 2024, which is exact, and describe 2025 as "roughly one in four."
Which states are at the top and bottom?
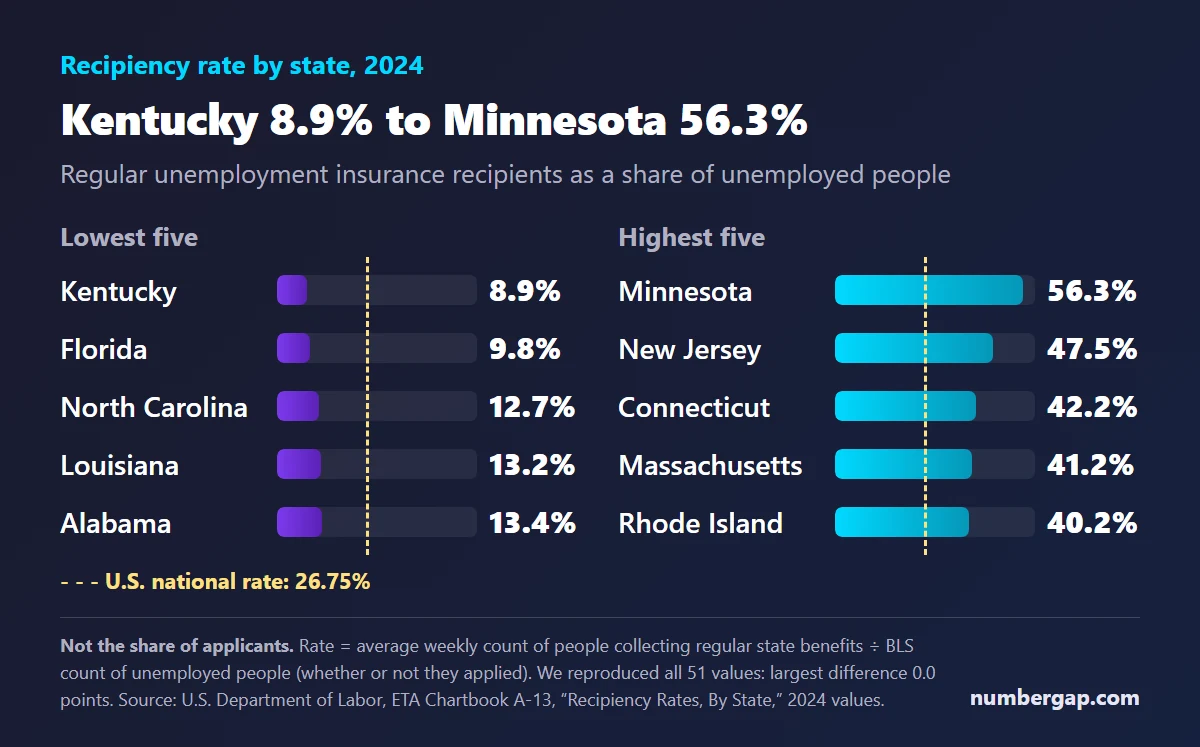
| Lowest, 2024 | Highest, 2024 |
|---|---|
| Kentucky 8.9% | Minnesota 56.3% |
| Florida 9.8% | New Jersey 47.5% |
| North Carolina 12.7% | Connecticut 42.2% |
| Louisiana 13.2% | Massachusetts 41.2% |
| Alabama 13.4% | Rhode Island 40.2% |
In the 2025 Chartbook the extremes are Florida at 8.3% and Minnesota at 49.9%. The state values depend on the year, so we say which one.
One more caution. The National Employment Law Project wrote in July 2025 that "nearly 59 percent" of unemployed Minnesotans received benefits in 2024. The Chartbook gives 56.3% today, and our own exact recomputation gives 56.3%. We could not reproduce 59. It may be an earlier data vintage.
Source: DOL ETA Chartbook A-13, 2024 and 2025 values; NELP, "Boosting Economic Resilience: Seven Ways States Can Support More Workers with UI," July 2025 (advocacy organization; secondary); Cleveland Fed, July 1, 2026 (secondary).
https://oui.doleta.gov/unemploy/chartbook.asp
Short benefit periods and low recipiency travel together. The Cleveland Fed cites a 0.61 correlation between a state's maximum weeks and its recipiency rate. In our own split of the 2024 values, the 15 states we classify as under 26 weeks averaged 16.6% recipiency, against 28.1% for the other 36. That is an association. State economies, industries and rules all differ.
Why Don't Most Unemployed People Get Unemployment Benefits?
Most never apply. The most direct evidence is a Bureau of Labor Statistics survey from 2022.
Source: BLS news release USDL-23-0586, "Unemployment Insurance Benefits Receipt," CPS supplement fielded February and May 2022, released March 29, 2023 (about 60,000 households; sponsored by DOL's Chief Evaluation Office) — federal survey estimates with sampling error
https://www.bls.gov/news.release/uisup.nr0.htm
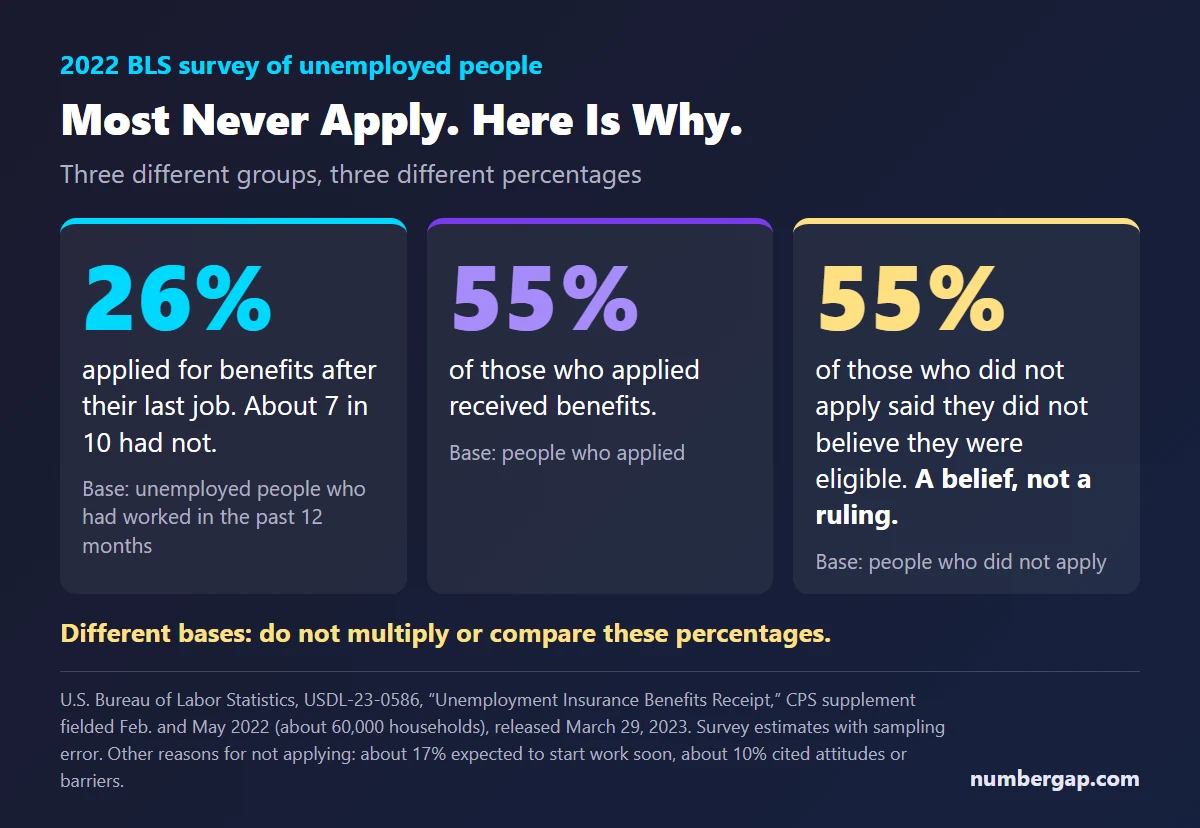
Among unemployed people who had worked in the previous 12 months, 26% had applied for benefits after their last job. About 7 in 10 had not.
Why not? Of those who didn't apply:
- 55% said they did not believe they were eligible.
- About 17% expected to start work soon.
- About 10% cited attitudes or barriers to applying.
- About 4% gave no reason.
And among those who did apply, 55% received benefits.
That 55% in the first bullet is a belief, not a ruling. We cannot say how many of those people would have been found eligible. Nobody can, from this survey. What it does show is that the biggest single reason for not applying is a guess about eligibility.
Does the reason you became unemployed change the odds?
A lot.
| Group | Applied | Received (of those who applied) |
|---|---|---|
| Job losers and people who finished temporary jobs | 37% | 59% |
| Job leavers | 11% | 35% |
| Re-entrants to the labor force | 10% | 34% |
Union coverage matters too: 57% of unemployed workers covered by a union applied, against 24% of those not covered.
We read these as two layers of "not qualifying." The first layer is people who never file. The second is people who file and are denied, or who run out. The survey speaks to the first layer and part of the second. The next section is about the end of that second layer, and it is the part we counted ourselves.
How Many People Run Out of Unemployment Benefits?
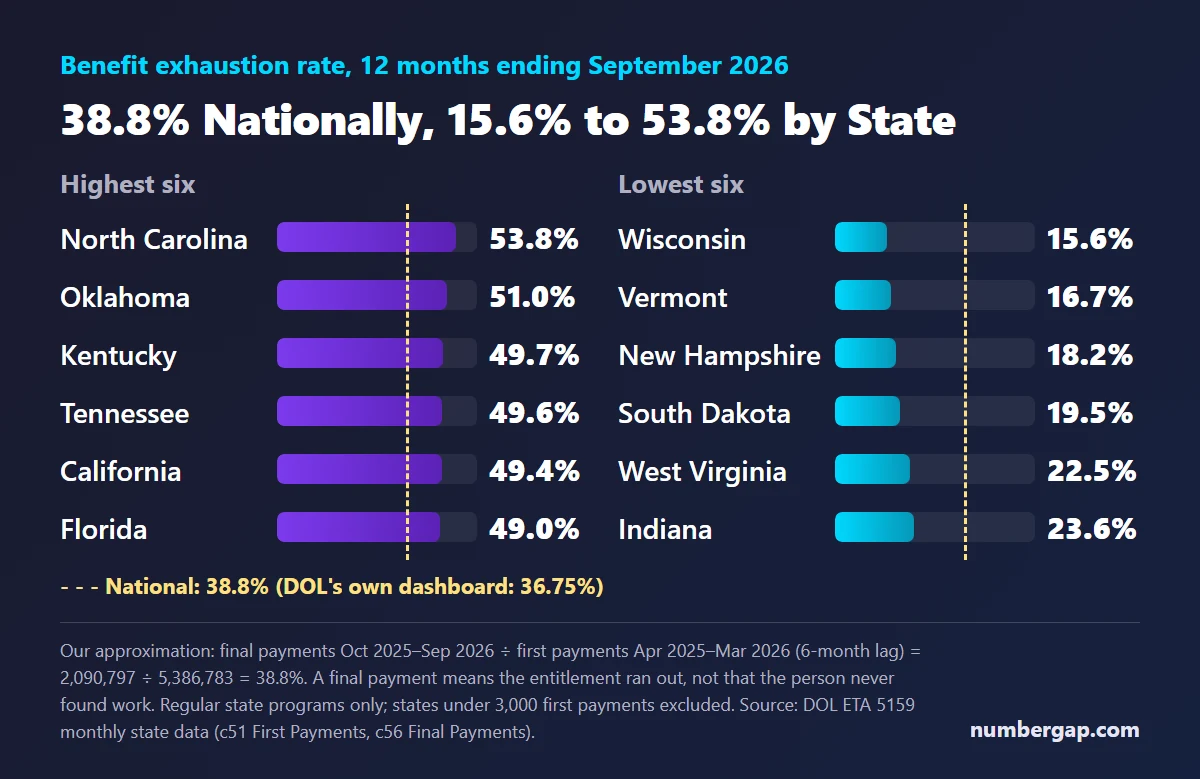
About two in five of the people who start collecting use up their full entitlement. Our count is 38.8% for the 12 months ending September 30, 2026.
DOL publishes a figure of its own. Its data dashboard shows an exhaustion rate of 36.75% for the same 12 months. The two land within two points of each other. We have not verified exactly how DOL computes its rate, so we cannot say what accounts for the gap. Ours is an approximation, and the method is below.
Source: DOL UI Data Dashboard (updated September 11, 2026) — federal agency statistic; our figure computed from DOL ETA 5159 data (see "How We Counted")
https://oui.doleta.gov/unemploy/DataDashboard.asp
The raw files let us do something the dashboard doesn't: split it by state and by year.
Which states have the highest and lowest exhaustion?
| Highest | Lowest |
|---|---|
| North Carolina 53.8% | Wisconsin 15.6% |
| Oklahoma 51.0% | Vermont 16.7% |
| Kentucky 49.7% | New Hampshire 18.2% |
| Tennessee 49.6% | South Dakota 19.5% |
| California 49.4% | West Virginia 22.5% |
| Florida 49.0% | Indiana 23.6% |
California is the biggest line. It had 969,168 first payments in our window and 478,460 final payments, 49.4%. Wisconsin had 81,115 first payments and 12,652 final payments, 15.6%.
The gap between those two is more than threefold. Both states cap benefits at 26 weeks. Hold that thought.
Is it getting worse?
Higher than before the pandemic, yes. Here is the same calculation for each 12-month window ending September 30.
| Window ending | Exhaustion rate |
|---|---|
| 2019 | 34.6% |
| 2020 | 109.8% (not a rate; see below) |
| 2021 | 29.1% (treat with care; see below) |
| 2022 | 29.5% |
| 2023 | 35.3% |
| 2024 | 38.6% |
| 2025 | 39.8% |
| 2026 | 38.8% |
The 2020 row is above 100%. That is not a rate. It means final payments in that window outnumbered first payments in the lagged window, because pandemic-era claimants were reaching the end of their benefits all at once. The 2021 window's first-payment count, 30.4 million, is about five times a normal year, so we would not lean on that row either.
What we will say is narrow. Today's 38.8% is higher than the 34.6% in 2019, the last window before the pandemic. We did not test why.
How did we count it?
Our measure is final payments divided by first payments. A final payment is the last payment that exhausts a claimant's entitlement. A first payment is the first check on a new claim.
Because a claim takes time to run its course, we compared final payments in the most recent 12 months (October 2025 to September 2026) with first payments in the 12 months that started six months earlier (April 2025 to March 2026). Nationally that is 2,090,797 final payments over 5,386,783 first payments. We left out states with fewer than 3,000 first payments in the window.
Source: Computed by us from DOL ETA 5159 "Claims and Payment Activities" monthly state data, 1971-01 to 2026-09 (35,456 rows). Column c51 is First Payments (state UI total); c56 is Final Payments (total), per the ET Handbook 402 data map.
https://oui.doleta.gov/unemploy/csv/ar5159.csv
A final payment means the entitlement ran out. It does not mean the person never found work.
Do Shorter Benefit Periods Mean More People Run Out?
On average, yes. But the average hides a much bigger gap.
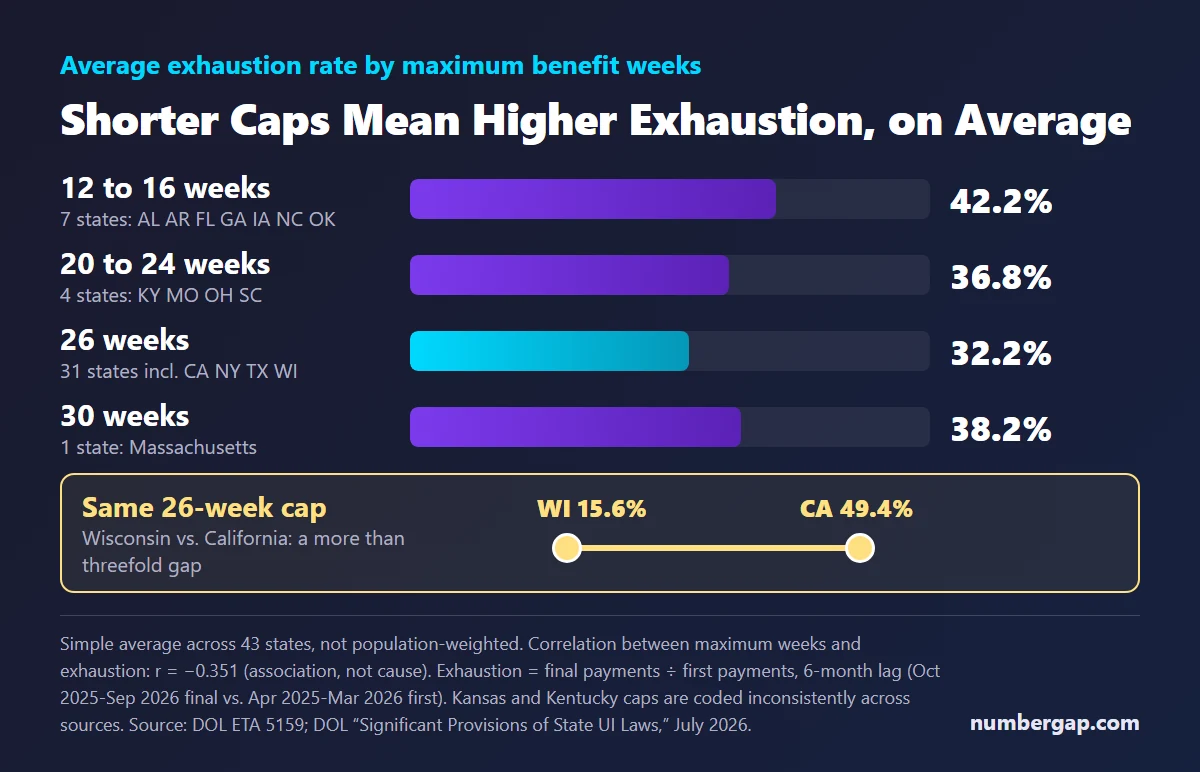
We grouped states by the maximum number of weeks in DOL's July 2026 table and averaged each group's exhaustion rate. The averages are simple averages across states, not weighted by population.
| Maximum weeks | States | Average exhaustion rate |
|---|---|---|
| 12 to 16 (AL, AR, FL, GA, IA, NC, OK) | 7 | 42.2% |
| 20 to 24 (KY, MO, OH, SC) | 4 | 36.8% |
| 26 (CA, NY, TX, WI and 27 others) | 31 | 32.2% |
| 30 (MA) | 1 | 38.2% |
Across 43 states with usable values the correlation between maximum weeks and exhaustion is -0.351. Shorter caps go with higher exhaustion.
Now look inside the 26-week group. California is 49.4%. Wisconsin is 15.6%. Same cap, three times the exhaustion.
So we will not write "short benefit periods cause more people to run out." The accurate sentence is this: states with shorter caps have higher exhaustion on average, but within the same 26-week cap the rate varies more than threefold. Local labor markets may matter more than the cap. We can't separate the two with this data.
What did we get wrong the first time?
We read the wrong column.
Our first run took the "Benefit Weeks Payable" column in DOL's July 2026 table as each state's maximum number of weeks. The correlation came out at -0.216. Then the output listed California at 14 weeks and Florida at 9.
Both are wrong. California pays up to 26 weeks. Florida pays up to 12.
We went back to the table. That column does not hold a maximum. It holds the range of weeks a claimant can receive, which for California is 14 to 26 and for Florida 9 to 12. The cap that applies now sits in the next column, "Calculation of Maximum Benefit Amount," where California reads "26 x WBA."
We switched columns and reran everything. The correlation moved to -0.351, the figure above.
The lesson is simple. Check whether a column's values make sense before trusting its label.
Even the corrected column has soft spots. Kansas's weeks cell says 10 to 16 while its formula cell says 26 x WBA, and state sources say 16. Kentucky's cap is rate-indexed and sources disagree. Our tier averages would move if those states were coded differently. We report them as computed.
Can You Get Unemployment If You Quit or Get Fired?
Sometimes. Which one it is depends on your state's definition of "good cause" or "misconduct," and on the facts, which the state decides.
Quitting without good cause disqualifies a claimant under every state's law, according to DOL. What counts as good cause varies. In many states it is limited to causes connected with the work or attributable to the employer. Others also recognize good personal cause.
Source: DOL, "Comparison of State Unemployment Insurance Laws 2023," Ch. 5 — federal agency compilation (2023 edition; confirm any single state with the state)
https://oui.doleta.gov/unemploy/comparison/2020-2029/comparison2023.asp
What do denial rates look like?
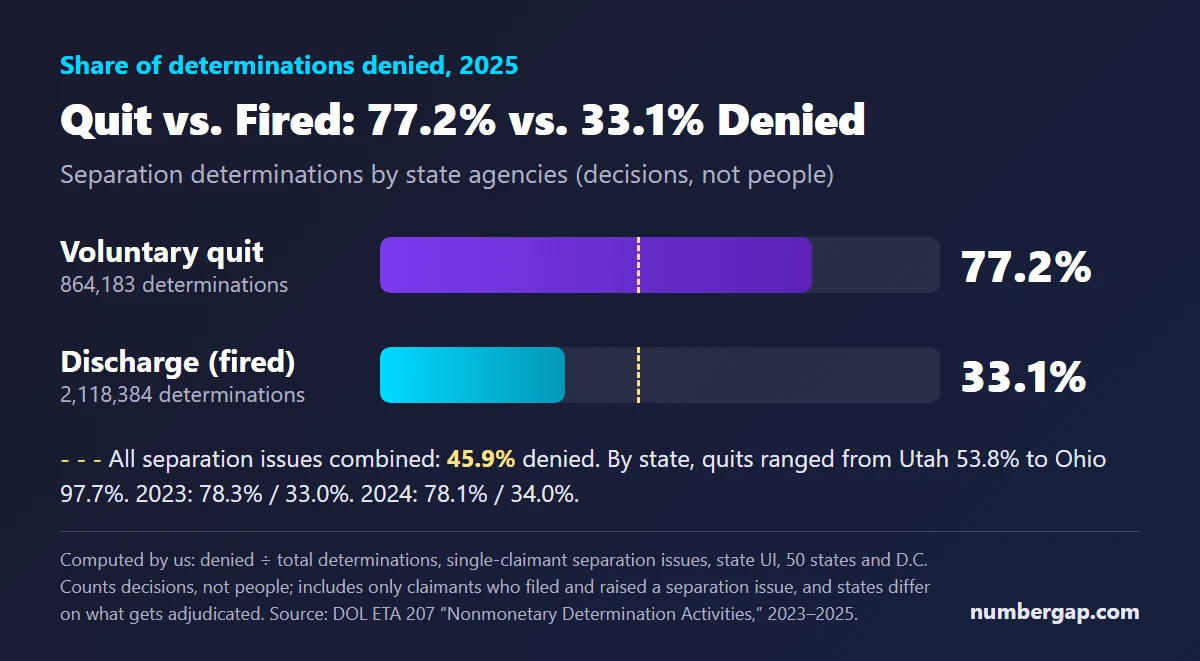
We counted them from DOL's ETA 207 file, which records separation determinations: decisions about why a job ended.
| Year | Quit determinations | Share denied | Firing determinations | Share denied |
|---|---|---|---|---|
| 2023 | 1,039,592 | 78.3% | 1,953,792 | 33.0% |
| 2024 | 965,648 | 78.1% | 2,118,442 | 34.0% |
| 2025 | 864,183 | 77.2% | 2,118,384 | 33.1% |
In 2025, 77.2% of voluntary-quit determinations ended in a denial, against 33.1% of discharge determinations. Across all separation issues, 45.9% were denied.
The state spread is wide. For quits, the denial share ranged from Utah at 53.8% to Ohio at 97.7% and Alabama at 97.2%. For firings, it ranged from D.C. at 11.7% to South Carolina at 59.7%.
Three cautions. These count decisions, not people, and one claimant can generate several. They include only claimants who filed and raised a separation issue, so they leave out the seven in ten who never file. And states differ on what gets adjudicated as a separation issue at all, so cross-state comparisons are suggestive, not exact.
The BLS survey points in the same direction. Of job losers who applied, 59% received benefits. Of job leavers who applied, 35% did.
Source: Computed by us from DOL ETA 207 "Nonmonetary Determination Activities," single-claimant separation issues, state UI, 2023-2025, 50 states and D.C. Counts are determinations, not people.
https://oui.doleta.gov/unemploy/csv/ar207.csv
How different is the wording from state to state?
Very. We are quoting statutes and agency guidance here, not predicting any case.
- Florida: "good cause" includes only cause attributable to the employing unit that would compel a reasonable employee to stop working, or the individual's illness or disability requiring separation. A disqualification lasts until the person has earned income of at least 17 times the weekly benefit.
- California: the Employment Development Department's guidance says the reason must be "real, substantial, and compelling," and that the worker has a duty to try to preserve the job first, for example by asking for leave or a transfer. The guidance pages are several years old.
- Pennsylvania: the law disqualifies a claimant who quits "without cause of a necessitous and compelling nature," and the claimant carries the burden of proof.
- North Carolina: DOL's 2023 table of personal good-cause provisions shows North Carolina as the only state with none of them.
Source: Fla. Stat. 443.101(1)(a) (2026 text); California EDD voluntary quit guidance; Pennsylvania uc.pa.gov voluntary quit page; DOL Comparison of State UI Laws 2023, Table 5-2 — statutes and agency guidance
https://www.leg.state.fl.us/Statutes/index.cfm?App_mode=Display_Statute&Search_String=&URL=0400-0499/0443/Sections/0443.101.html
A quit without good cause is not a permanent bar in most states. DOL's 2023 table of requalification terms shows the usual route is to return to work and earn a multiple of the weekly benefit: 3 times in Kansas, 5 in Arizona and Hawaii, 10 in Alabama, Georgia and Louisiana, 12 in Michigan, 14 in Idaho, 15 in Maryland and 17 in Florida. That reading is ours, and the 2023 edition may be out of date.
What counts as misconduct?
Many states define it using a 1941 Wisconsin Supreme Court case, Boynton Cab Co. v. Neubeck. The court described misconduct as conduct "evincing such willful or wanton disregard of standards of behavior which the employer has the right to expect of his employee," or carelessness of such degree as to show equal culpability, wrongful intent or evil design.
Some states widen the definition to cover attendance violations, breaking employer rules, damaging property or losing a required license. Being laid off, or let go for poor performance, is not disqualifying in most states. Being fired for a deliberate rule violation can be. Whether your own case fits either description is for your state to decide.
Source: DOL, "Comparison of State Unemployment Insurance Laws 2023," Ch. 5 and Table 5-6 — federal agency compilation (2023 edition)
https://oui.doleta.gov/unemploy/comparison/2020-2029/comparison2023.asp
Can Gig Workers and Freelancers Get Unemployment?
Generally not under regular unemployment insurance, because the program covers employees.
The Congressional Research Service puts it plainly: "Self-employed workers — potentially including independent contractors and gig economy workers — are the largest group of workers generally excluded from eligibility for UC benefits."
The mechanics follow from that. A worker paid on a 1099 has no employer-reported wage record to meet the base-period test, and the platform has not paid state unemployment tax on those earnings. That reading is ours.
There is one door that can open. If a state decides a worker was really an employee, coverage can exist. Many states use the "ABC" test, under which a worker is treated as an employee unless all three conditions are met: the worker is free from the company's direction and control, the work is outside the company's usual course of business or outside all its places of business, and the worker is customarily engaged in an independent trade or business. Those classification decisions are made by state unemployment agencies. They are separate from the federal wage-and-hour rule, so the two should not be mixed up.
Source: DOL, "Comparison of State UI Laws 2023," Ch. 1 (Coverage); CRS R48447, March 6, 2025 — federal sources. The misclassification examples reported elsewhere (a Wisconsin Supreme Court ruling on Amazon drivers, a $19.4 million New Jersey settlement) come from compliance-industry summaries we did not check against the original rulings.
https://oui.doleta.gov/unemploy/comparison/2020-2029/comparison2023.asp
What happened to the pandemic program for gig workers?
Congress created Pandemic Unemployment Assistance in the CARES Act for people not otherwise eligible, including the self-employed, independent contractors and gig workers. It paid $131.8 billion in total, according to CRS.
It ended. DOL's guidance of September 3, 2021 says PUA "may not be paid for any weeks of unemployment ending after September 6 2021." Several states stopped earlier. The Century Foundation estimated that about 4.2 million people on PUA would lose benefits at the cutoff.
We did not find any permanent federal or state program that replaced it as of October 2026. A Senate bill from Wyden, Bennet and Beyer would add a new "jobseeker's allowance" for workers excluded from current coverage. It has not passed.
Source: DOL Unemployment Insurance Program Letter 16-20, Change 6 (September 3, 2021); CRS R48447; Century Foundation estimate as reported by CBS News (secondary)
https://www.dol.gov/node/159960
How We Counted, and Where It Could Be Wrong
Every number marked "computed by us" came from free bulk files on the Labor Department's website. You can rerun all of it.
Files and definitions
- Payments: ETA 5159 monthly state data, https://oui.doleta.gov/unemploy/csv/ar5159.csv
- Column definitions: ET Handbook 402, chapter 4 data map, https://oui.doleta.gov/dmstree/handbooks/402/402_4/4024c6/4024c6.pdf (column c51 is First Payments, c56 is Final Payments)
- Weeks by state: DOL, "Significant Provisions of State Unemployment Insurance Laws," July 2026
The six places this could be wrong
- The six-month lag is an approximation. States differ in how long people stay on benefits, so first and final payments don't line up perfectly. The lag may be too long for states with short benefit periods.
- A final payment is an exhausted entitlement, not a failure to find work. People who start a job and then reopen a claim are mixed in.
- Regular state programs only. We left out federal programs and Extended Benefits.
- Duration codes are imperfect. Kentucky's cap differs between DOL's table and state sources, and Kansas's cells disagree, as described above.
- Observational data. The link between benefit length and exhaustion is a correlation, not a cause.
- State comparisons mix many things. Unemployment rates, industries and how strictly claims are reviewed all differ.
We also did not research how unemployment insurance treated federal employees during the fall 2025 government shutdown.
Frequently Asked Questions
Q. Who qualifies for unemployment benefits?
A. Your state decides. Generally you need enough wages or hours in a base period, a job that ended through no fault of your own, and to be able, available and looking for work each week. Your state's unemployment agency makes the determination from your records.
Q. What percent of unemployed people get unemployment benefits?
A. DOL's recipiency rate was 26.75% in 2024, meaning the average weekly count of people collecting regular benefits divided by the number of unemployed people BLS counted. It ranged from 8.9% in Kentucky to 56.3% in Minnesota. It is not the share of applicants who are paid. In a 2022 BLS survey, 55% of applicants received benefits.
Q. How long does unemployment last?
A. Between 12 and 30 weeks depending on the state. Twenty-six weeks is the ceiling in most states. Arkansas, Florida and North Carolina are at 12, and Massachusetts can reach 30. In 2025, 61.2% of new claims were assigned 26 to 27 weeks and 22.9% were assigned under 20 weeks.
Q. Which states pay the fewest weeks of unemployment?
A. Arkansas, Florida and North Carolina at 12 weeks. Louisiana and Tennessee are indexed to the unemployment rate (12 to 20 weeks). By our reading of DOL's July 2026 table about 15 states pay less than 26 weeks; other organizations count 14 or 16.
Q. Do you have to work a certain number of months to qualify for unemployment?
A. There is no national rule. Each state sets its own earnings or hours test for the base period. DOL's July 2026 table lists, for example, 680 hours in Washington and $5,500 in Utah. The Labor Department notes that no federal minimum duration or benefit level exists.
Q. Can you get unemployment if you quit your job?
A. Quitting without good cause disqualifies a claimant in every state, but "good cause" is defined differently in each. In 2025, 77.2% of voluntary-quit determinations were denied, against 33.1% of discharge determinations (our computation). Whether your reason counts is decided by your state.
Q. Can you collect unemployment as a 1099 or gig worker?
A. Generally no, because regular unemployment insurance covers employees. A state can classify a particular worker as an employee, and that classification is made by the state. The pandemic program for gig workers ended for weeks after September 6, 2021.
Q. What does it mean to exhaust unemployment benefits?
A. It means using up the full number of weeks you were entitled to. We measured it as final payments divided by first payments: 38.8% for the 12 months ending September 30, 2026. DOL's own dashboard shows 36.75% for the same period.
Before You File: What to Check First
If you are about to file, three things are worth knowing.
- Don't rule yourself out. In the 2022 BLS survey, the biggest reason people gave for not applying was that they did not believe they were eligible. The agency decides eligibility, not a guess and not this post.
- Read your own state's rules. The DOL table is a starting point. Your state's agency page is the authority on the base period, the weeks you can get and the good-cause standard.
- Expect a process. DOL says claimants must file weekly or biweekly after each week ends, report earnings and job offers, and keep meeting eligibility requirements. Some states have a one-week waiting period, and a first benefit usually arrives two to three weeks after you file.
Source: DOL, "State Unemployment Insurance Benefits" fact sheet — agency guidance
https://oui.doleta.gov/unemploy/uifactsheet.asp
Once you know you qualify, the next question is how much. We worked that out in How Much Does Unemployment Pay? Your State Decides Most of It.
This post summarizes laws and Labor Department data. It is not legal advice, and decisions about individual claims belong to your state's unemployment agency or a qualified professional. If this was helpful, we'll see you in the next post.


Comments
Post a Comment