Why Is a Hospital Bill 5x What Gets Paid? (Medicare Data)
We sorted every state by one ratio: what hospitals billed Medicare for a stay, divided by what was actually paid.
Last updated: 27 October 2026 · Figures and rules in this post are current as of this date.
Nevada sat at the top, at 9.10. Colorado, Florida, Texas and New Jersey followed, all above 6.5. The list stepped down through Wyoming, Montana and Rhode Island, and bottomed out at Massachusetts, 2.67.
Then there was one more row.
Maryland: 1.11.
That row is why this post exists. A hospital bill and the money that changes hands are usually far apart. In Maryland, they are not.
The data file itself doesn't say why. So we went looking.
How big is the gap between a hospital bill and what actually gets paid?
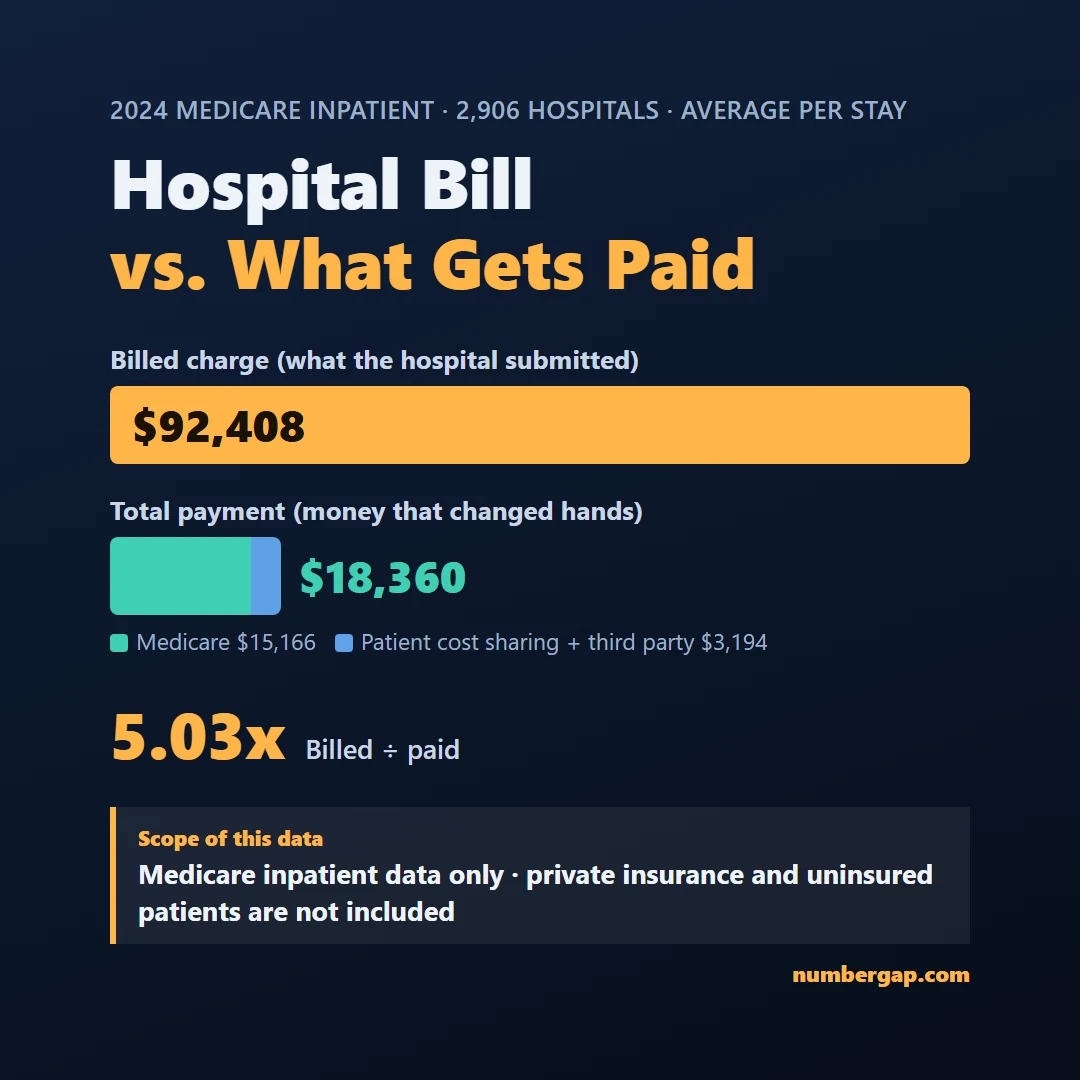
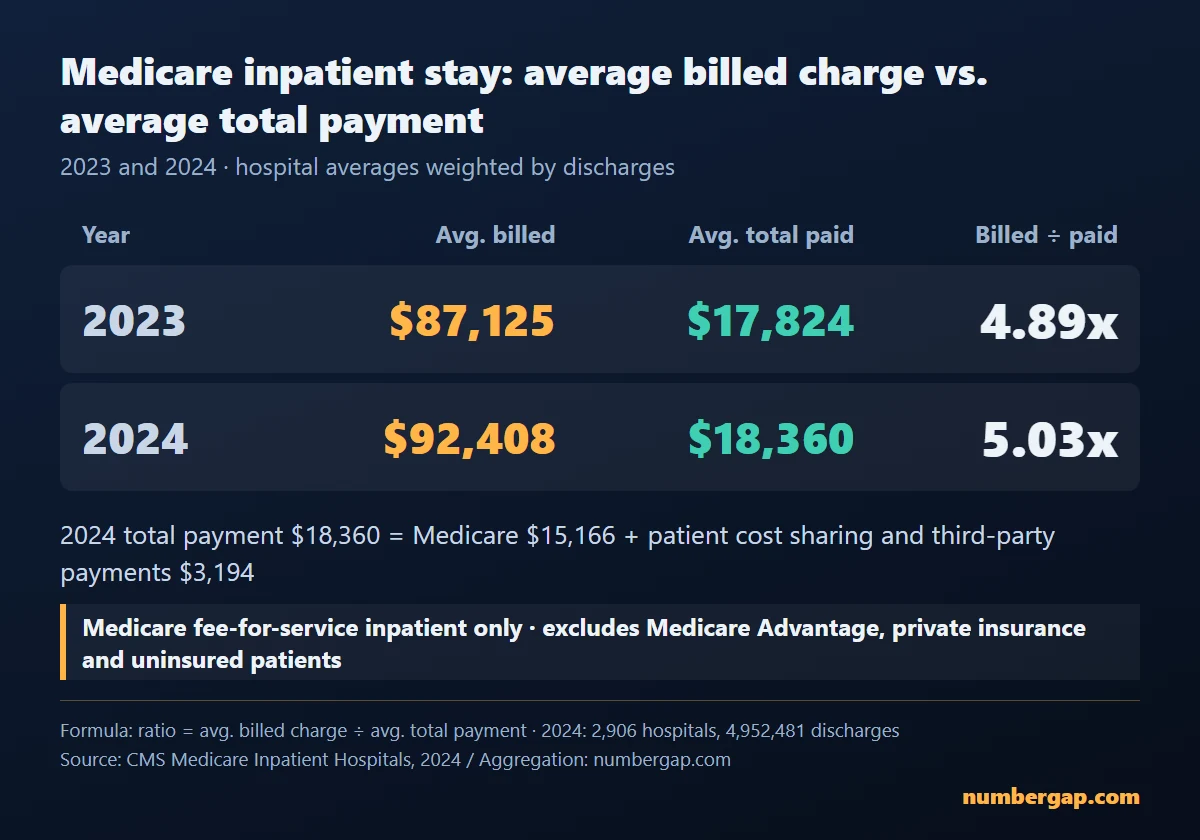
In 2024 Medicare inpatient data, the average billed charge was $92,408 per stay. The average total payment was $18,360. Billed charges ran about five times payments.
The "bill" here is the charge a hospital submits to Medicare. Medicare is the federal health insurance program for people 65 and older, plus some younger people with disabilities. The file covers 2,906 hospitals and 4,952,481 discharges, and each hospital's average is weighted by its discharges.
About four-fifths of the number on the bill never turned into money changing hands.
We ran the same math on 2023. Billed: $87,125. Paid: $17,824. A ratio of 4.89. So this is not one odd year.
| Year | Average billed | Average paid | Ratio |
|---|---|---|---|
| 2023 | $87,125 | $17,824 | 4.89x |
| 2024 | $92,408 | $18,360 | 5.03x |
The $18,360 is not Medicare's money alone. By the CMS data dictionary, total payment is Medicare's share plus the patient's own cost sharing (deductibles and copayments) plus payments from third parties such as supplemental insurance. Medicare's share was $15,166. The other $3,194 is patient cost sharing and third-party payments. That is a definition, not a guess.
Source: CMS, "Medicare Inpatient Hospitals - by Provider and Service," 2023 and 2024 data, our own aggregation — federal agency data, posted continuously
2024: https://data.cms.gov/sites/default/files/2026-04/828defb5-c9e6-4442-8c1b-f27bc0799daf/MUP_INP_RY26_P03_V10_DY24_PrvSvc.CSV
2023: https://data.cms.gov/sites/default/files/2025-05/ca1c9013-8c7c-4560-a4a1-28cf7e43ccc8/MUP_INP_RY25_P03_V10_DY23_PrvSvc.CSV
Source: data.cms.gov "Medicare Inpatient Hospitals" methodology (https://data.cms.gov/sites/default/files/2024-06/MUP_INP_RY24_20240523_Methodology_508.pdf) and data dictionary, viewed Oct. 27, 2026 — definitions from the agency that built the dataset
Do not read this as "my bill will be five times too high." CMS itself lists the limits in its methodology document.
- The file holds Medicare fee-for-service inpatient stays only. Medicare Advantage plans (Medicare run through private insurers), private insurance and uninsured patients are not in it. CMS writes that the data "may not be representative of a hospital's entire population served."
- Records with 10 or fewer discharges are dropped to protect privacy.
- Only short-term acute-care inpatient stays under the inpatient prospective payment system (IPPS) are included. Long-term care, rehabilitation and psychiatric stays are out.
- Every figure is an average by hospital and diagnosis group. It is not any one patient's bill, and hospitals treat different mixes of patients, so the numbers do not point at any particular hospital.
Source: data.cms.gov "Medicare Inpatient Hospitals" methodology (https://data.cms.gov/sites/default/files/2024-06/MUP_INP_RY24_20240523_Methodology_508.pdf), Chapter 5, Data Limitations, viewed Oct. 27, 2026 — limits stated by the agency that built the dataset
Look at the first item again. The people this post is ultimately about, uninsured patients, are not in this data. Not one.
So the file can tell us one thing about them. The charge a hospital sends out bears little relation to what is paid. It cannot tell us what an uninsured patient's bill will say. It can only show what kind of number that bill starts from.
Why do two hospitals bill 20x apart for the same surgery?
For the same surgery, billed charges differed by as much as 20x between hospitals, while the payments sat in a much narrower band.
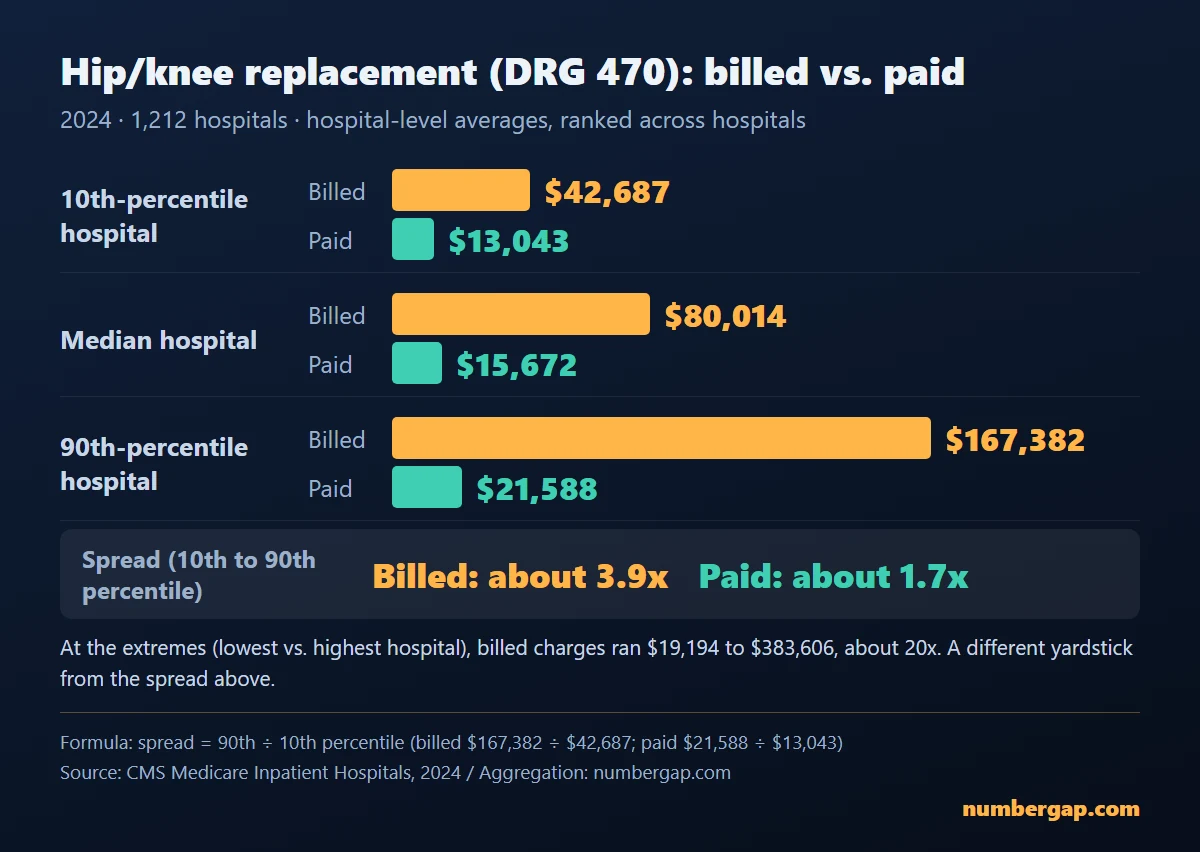
We pulled one procedure: hip and knee replacement without major complications (DRG 470). In 2024, 1,212 hospitals reported it. Line them up and compare the hospital 10% of the way up the list with the hospital 90% of the way up.
| 10% point | Median | 90% point | Spread | |
|---|---|---|---|---|
| Billed | $42,687 | $80,014 | $167,382 | about 3.9x |
| Paid | $13,043 | $15,672 | $21,588 | about 1.7x |
At the extremes, the gap widens. One hospital billed an average of $19,194. Another billed $383,606. That is roughly 20x.
Same surgery. And the number on the bill tells you almost nothing about what the hospital was paid.
Source: CMS, "Medicare Inpatient Hospitals - by Provider and Service," 2024 data (DRG 470), our own aggregation — federal agency data. Figures are hospital-level averages; percentiles are computed across hospitals
One limit matters here. Medicare payments come from a formula in nearly every state (Maryland is the exception, covered below). A narrow band of payments is partly built into the design. So the finding is not "payments are uniform." It is "billed charges bear little relation to payments."
Where does the bill number come from? Every hospital keeps a list price for each item and service. It is called the chargemaster. Federal regulation defines a hospital's "gross charge" as the charge for an item or service "reflected on a hospital's chargemaster, absent any discounts."
Source: 45 CFR 180.20 — federal regulation text
https://www.law.cornell.edu/cfr/text/45/180.20
Outside Maryland, Medicare pays an inpatient stay through a formula built on diagnosis groups. Charges enter that formula in one place that MedPAC points to: the extra "outlier" payment for unusually costly patients.
Source: MedPAC (Lisk and Stensland), "Medicare outlier payments and hospital charging practices," Nov. 3, 2016 — preliminary analysis of 2014 Medicare data
https://www.medpac.gov/wp-content/uploads/2016/11/Medicare-outlier-payments-and-hospital-charging-practices-v3_for_laptop.pdf
Private insurers work differently. In a 2023 Health Affairs study of 2,379 hospitals and 70 common services, commercial negotiated rates averaged 58% of the chargemaster price. Cash prices averaged 64%. Insurers often negotiate a standing percentage off the list.
Source: Wang et al., "The Relationships Among Cash Prices, Negotiated Rates, And Chargemaster Prices For Shoppable Hospital Services," Health Affairs 2023 — read through the PubMed abstract. Prices posted as of Sept. 9, 2022; limited to 70 shoppable services
https://pubmed.ncbi.nlm.nih.gov/37011313/
How much more than Medicare do private plans pay? A RAND study found that in 2022, employers and private insurers paid on average about 2.5 times what Medicare would have paid for the same hospital services. That average covers inpatient and outpatient care, facility and physician claims. The data came from an employer-led initiative, not a random sample of all private insurance. Maryland is excluded.
Source: RAND, "Prices Paid to Hospitals by Private Health Plans: Findings from Round 5.1" (RR-A1144-2-v2), Dec. 10, 2024 — employer-led study funded by the Robert Wood Johnson Foundation and participating employers
https://www.rand.org/pubs/research_reports/RRA1144-2-v2.html
So why are list prices so high? The explanations conflict.
Maryland's rate-setting commission, the HSCRC, says hospitals elsewhere "must artificially mark-up their charges by 100-200 percent" to cover uncompensated care, discounts to large HMOs and low Medicare and Medicaid payments. RAND's slides to Vermont's Green Mountain Care Board say the opposite: the share of public-payer patients is not correlated with relative prices, there is "no evidence of cost shifting," and market power explains 18% of price variation.
One is a regulator describing its own system. The other is a RAND briefing on its employer-led study. That they disagree is the confirmed part. We cannot tell you which is right.
Source: HSCRC press release for FY2006, July 18, 2007 — the agency's own description, read through an archive copy
https://hscrc.maryland.gov/Documents/Hospitals/ReportsFinancial/DisclosureReports/FinancialDisclosureReports/Archive/Financial%20Disclosure%20FY2006.pdf
Source: RAND, "RAND Hospital Price Transparency Project," briefing to the Vermont Green Mountain Care Board, Aug. 2024 — RAND's claims as presented in a slide deck
https://gmcboard.vermont.gov/sites/gmcb/files/documents/RAND%20hospital_August-2024-VT.pdf
Is there a state where the hospital bill matches what gets paid?
Yes. One. Maryland.
Here are the five highest and five lowest states, 2024, billed charges divided by payments.
| Highest 5 states | Ratio | Lowest 5 states | Ratio |
|---|---|---|---|
| Nevada | 9.10 | Wyoming | 3.00 |
| Colorado | 7.36 | Montana | 2.92 |
| Florida | 7.12 | Rhode Island | 2.74 |
| Texas | 6.77 | Massachusetts | 2.67 |
| New Jersey | 6.54 | Maryland | 1.11 |
A gentle staircase ends at 2.67. Then there is one more step down, to 1.11.
Source: CMS, "Medicare Inpatient Hospitals - by Provider and Service," 2024 data, state-level ratios from our own aggregation — federal agency data
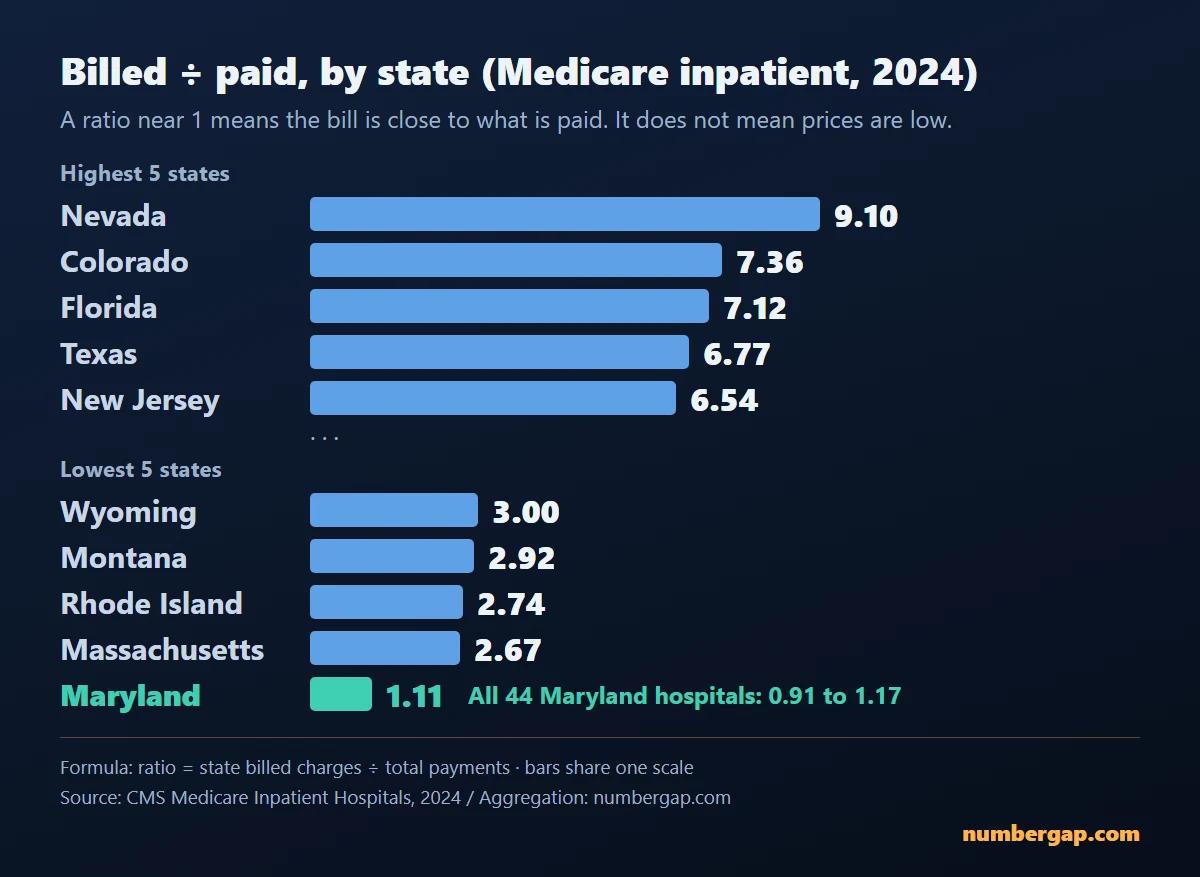
One hospital could be a fluke. So we opened Maryland's hospitals one by one. All 44 in the file landed between 0.91 and 1.17. Nationally, the line marking the lowest 10% of hospitals was 2.17. Not one Maryland hospital reached it.
It is not one hospital. It is a whole state.
One value was 0.91, which means that hospital was paid more than it billed. We could not determine why that happens, or why Maryland hospitals do not all land on exactly 1.00.
So why Maryland? To find out, we opened the methodology document CMS published with the dataset. Chapter 5 is titled "Data Limitations." It contains this sentence:
"The state of Maryland has a unique waiver that exempts providers from Medicare's prospective payment systems for inpatient care. Maryland instead uses an all-payer rate setting commission to determine its payment rates."
We had spotted the one state that stood apart in the data. The agency that built the data had already named it, in the chapter where it lists the dataset's limits. Not a think tank. Not a news story. CMS's own document.
The same paragraph adds that Medicare claims for hospitals in other states break out additional payments for indirect medical education (IME) and disproportionate share hospital (DSH) adjustments. We come back to that below.
Source: data.cms.gov "Medicare Inpatient Hospitals" methodology (https://data.cms.gov/sites/default/files/2024-06/MUP_INP_RY24_20240523_Methodology_508.pdf), Chapter 5, Data Limitations, viewed Oct. 27, 2026 — the agency's own document
How that waiver came about is in Maryland's own record.
Maryland's legislature created the Health Services Cost Review Commission in 1971. After a three-year phase-in, it began setting rates in July 1974, at first only for non-government purchasers. In 1977, Maryland became the first of five states granted a federal waiver from national Medicare and Medicaid payment principles. Since then, all payers have paid Maryland hospitals according to HSCRC's rates.
The HSCRC still describes itself this way on its own site: "Maryland remains the only state to retain such a system."
Source: HSCRC, "About HSCRC" — the agency's own description, read through an archive copy (checked Oct. 27, 2026)
https://hscrc.maryland.gov/Pages/About-Us.aspx
That is how we read the 1.11: in Maryland the bill behaves more like a real price list than a sticker price. CMS confirms that Maryland's payments are set a different way. That this different way produced the 1.11 is still our interpretation. We did not test it separately.
Three caveats travel with that number.
- It is a hospital-facility figure. The HSCRC says it does not regulate physician fees.
- RAND's 2.5x figure excludes Maryland. It does not apply there.
- Ranked hospital by hospital, the national median is 4.15x. The 5.03x above is an average pulled up by hospitals with many discharges.
Is Maryland's hospital rate-setting actually better?
A 1.11 means the bill is close to the payment. It does not mean hospital care is cheap.
Before we get to price levels, we owe you a correction.
What we got wrong first: 21% versus 172%
When we first pulled Maryland's number, we wanted something to check it against. We found it in a July 18, 2007 HSCRC press release. Maryland hospital mark-up averaged 21 percent, it said, while the national average was 172 percent, citing American Hospital Association data.
The direction matched. Our Maryland number sat near 1 and the national number ran several times higher. So we wrote it down as an independent cross-check, 17 years apart.
We were wrong.
The denominators differ.
The HSCRC release defines mark-up as "the difference between hospital costs and charges." The baseline is the hospital's cost. Ours divides charges by what Medicare actually paid. Both get called mark-up. They are measured with different rulers.
The release does not spell out its formula. Reading it the usual way, (charges minus cost) divided by cost, a 21% mark-up would mean charges were 1.21 times cost. That reading is our assumption.
The latest edition we could verify is the HSCRC release of Nov. 12, 2014, for fiscal 2013: Maryland 42 percent, national 221 percent. Maryland's own mark-up roughly doubled from 21 to 42 percent, while the national figure rose from 172 to 221. The gap stayed large, but Maryland's number was not frozen. We found no later edition with the same line.
It is also worth remembering who published these numbers. The agency that runs the system.
Source: HSCRC, Disclosure of Hospital Financial and Statistical Data FY2013, Nov. 12, 2014 — the agency's own report, read through an archive copy
https://hscrc.maryland.gov/Documents/pdr/ar/HSCRC-Disclosure-Report-FY-2013.pdf
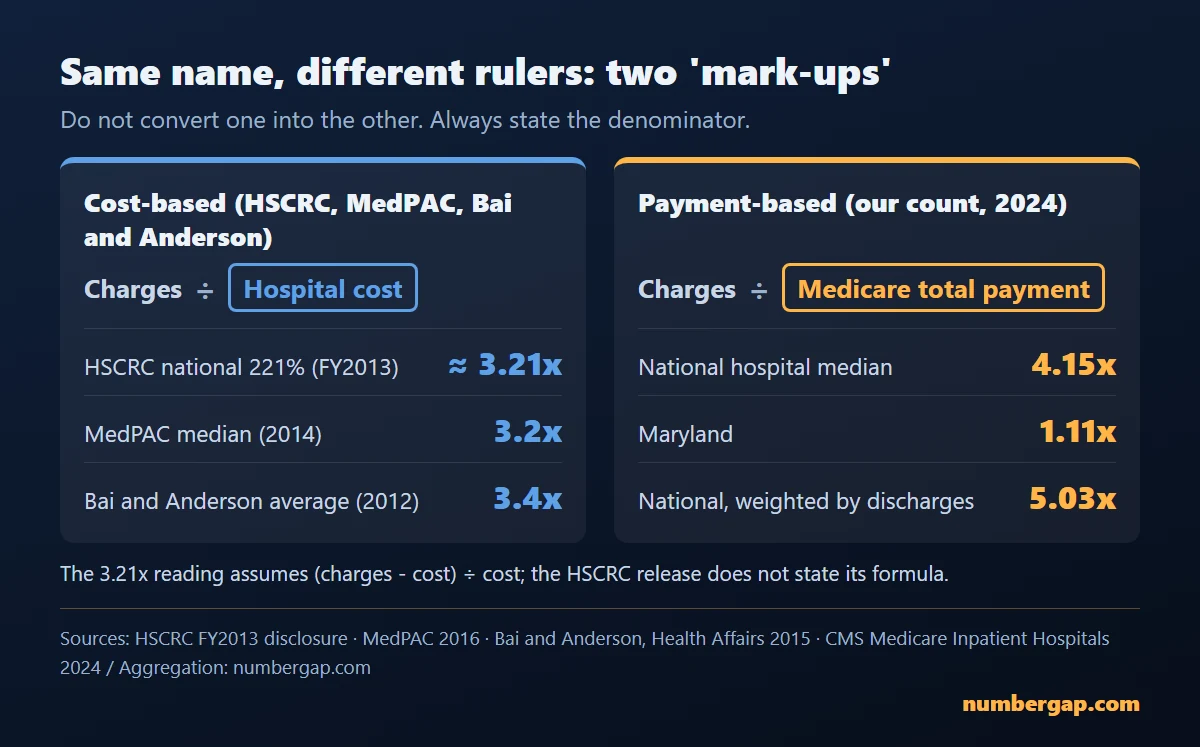
This table is why we state the denominator every time.
| Who | Numerator | Denominator | Value |
|---|---|---|---|
| HSCRC | Charges | Hospital cost (formula not stated) | Maryland 21% to 42%, national 172% to 221% (FY2006 to FY2013) |
| MedPAC | Charges | Hospital cost | Median 3.2x (2014 Medicare data) |
| Bai and Anderson | Charges | Hospital cost | National average 3.4x (2012 data) |
| Our aggregation | Charges | Medicare total payment | National hospital median 4.15x, Maryland 1.11x (2024) |
Read the HSCRC's 221% as 3.21x, and the three cost-based sources land around 3.2 to 3.4x. Put payment in the denominator, as we did, and you get roughly 4 to 5x. Different rulers. Do not convert one into the other.
Source: MedPAC, Nov. 3, 2016 (above); Bai and Anderson, "Extreme Markup: The Fifty US Hospitals With The Highest Charge-To-Cost Ratios," Health Affairs 2015 — read through the PubMed abstract
https://pubmed.ncbi.nlm.nih.gov/26056196/
The direction agrees: charges sit far above real prices. But agreeing on direction is not the same as confirming a value.
We had a tidy cross-check in hand. We put it down.
How do the evaluations and critics see it?
Start with the report cards. A CMS evaluation summary (March 2024) says Maryland's Total Cost of Care Model produced $689 million in net Medicare savings over its first three years, with hospital admissions down 16.2%. The same document says effects since 2019 have been sustained but not increased, and that the effect on total Medicare spending has gotten smaller.
Mathematica, the evaluator, reported in February 2023 about $781 million (2.5%) in savings for 2019 to 2021. The two figures differ. Different periods or accounting may explain it. We could not confirm that. A Health Affairs abstract from April 2026 says Maryland hospital utilization fell 11 percentage points more than in other states, and its authors warn of the risk of stinting on patient care.
Now the critics. The Manhattan Institute, a market-oriented think tank, published a report by Chris Pope on June 26, 2019. It argues the commission "has been captured by the hospitals that it was intended to regulate," with two of seven seats held by hospital executives. It says fixed inpatient rates pushed services toward outpatient and surgery centers outside the rules, and that penalties capped at 1% of revenue are "mostly symbolic." It also says that in 2015 commercial hospital payments were 13% below national levels while Medicare paid 40% more for inpatient and 60% more for outpatient care. Those are a think tank's claims. We have not verified them.
Other states tried and quit. In a 1991 paper, Gerard F. Anderson wrote that New York and Massachusetts gave up their Medicare waivers in 1985 and New Jersey in 1989, leaving Maryland as the only state with an all-payer rate-setting program. The same paper reported that Maryland's cost per adjusted admission went from 25% above the national average in 1976 to 8% below in 1990.
Source: CMS Innovation Center, "Maryland Total Cost of Care Model: Evaluation of the First Four Years (2019-2022), Findings at a Glance," March 2024 — evaluation summary
https://cms.gov/priorities/innovation/data-and-reports/2024/md-tcoc-1st-progress-rpt-aag
Source: Mathematica news release, Feb. 6, 2023; Bulat et al., Health Affairs 2026;45(4) — the paper was read through its PubMed abstract
https://mathematica.org/news/maryland-saved-medicare-more-than-780-million-using-new-approach-to-payment
https://pubmed.ncbi.nlm.nih.gov/41941672/
Source: Manhattan Institute (Chris Pope), June 26, 2019 — think tank claims, not verified by us
https://manhattan.institute/medicare-for-all-maryland-hospital-healthcare-price-regulation
Source: Anderson GF, "All-payer ratesetting: Down but not out," Health Care Financing Review, 1991 Annual Supplement — CMS-hosted paper
https://www.cms.gov/files/document/hcfr-91-supp-035pdf
What is changing in Maryland now? (as of Oct. 27, 2026)
The system is still running, but it is in transition. CMS ended the Total Cost of Care Model on Dec. 31, 2025, and Maryland moved to the AHEAD Model (2026 to 2035), whose implementation began in January 2026. The share of all-payer hospital revenue that must be paid under a global budget falls from 95% to 85%, and Medicare's piece shifts toward a federal national methodology starting in 2028.
The Maryland Association of Counties warns that if the HSCRC loses authority, hospitals could negotiate prices directly with insurers and employers, which could raise costs for self-insured employers. The Maryland Hospital Association says hospitals continue to face financial pressure. Both are interested parties. Neither outcome is settled.
Source: HSCRC Total Cost of Care Workgroup slides, Jan. 28, 2026 — read through an archive copy
https://hscrc.maryland.gov/Documents/Work%20Group%20Uploads/Total%20Cost%20of%20Care%20(TCOC)/2026/January%2028%20TCOC%20Workgroup%20Slides%20FINAL%201.pdf
Source: Maryland Association of Counties, "2026 Issue Preview: Hospital Rate Setting and the AHEAD Model," Dec. 31, 2025; Maryland Hospital Association comment letter, May 20, 2026 — statements by interested parties
https://conduitstreet.mdcounties.org/2025/12/31/2026-issue-preview-hospital-rate-setting-and-the-ahead-model/
https://mhaonline.org/wp-content/uploads/2026/05/HSCRC-Draft-Recommendation-for-RY2027-Update-Factor-MHA-Comment-Letter-May-2026.pdf
What happens to an uninsured patient's hospital bill?
The law offers some protection, but it is narrow, and no national statistic tells us how often an uninsured patient is billed the full list price.
The data we just used had no uninsured patients in it. So from here we leave the dataset and read statutes and studies.
This is where the spread in billed charges stops being an abstraction. Medicare pays what its formula says, whatever the bill says. For someone without insurance, that same unmoored number can be the first bill they receive.
Here is the evidence behind "can be," one piece at a time.
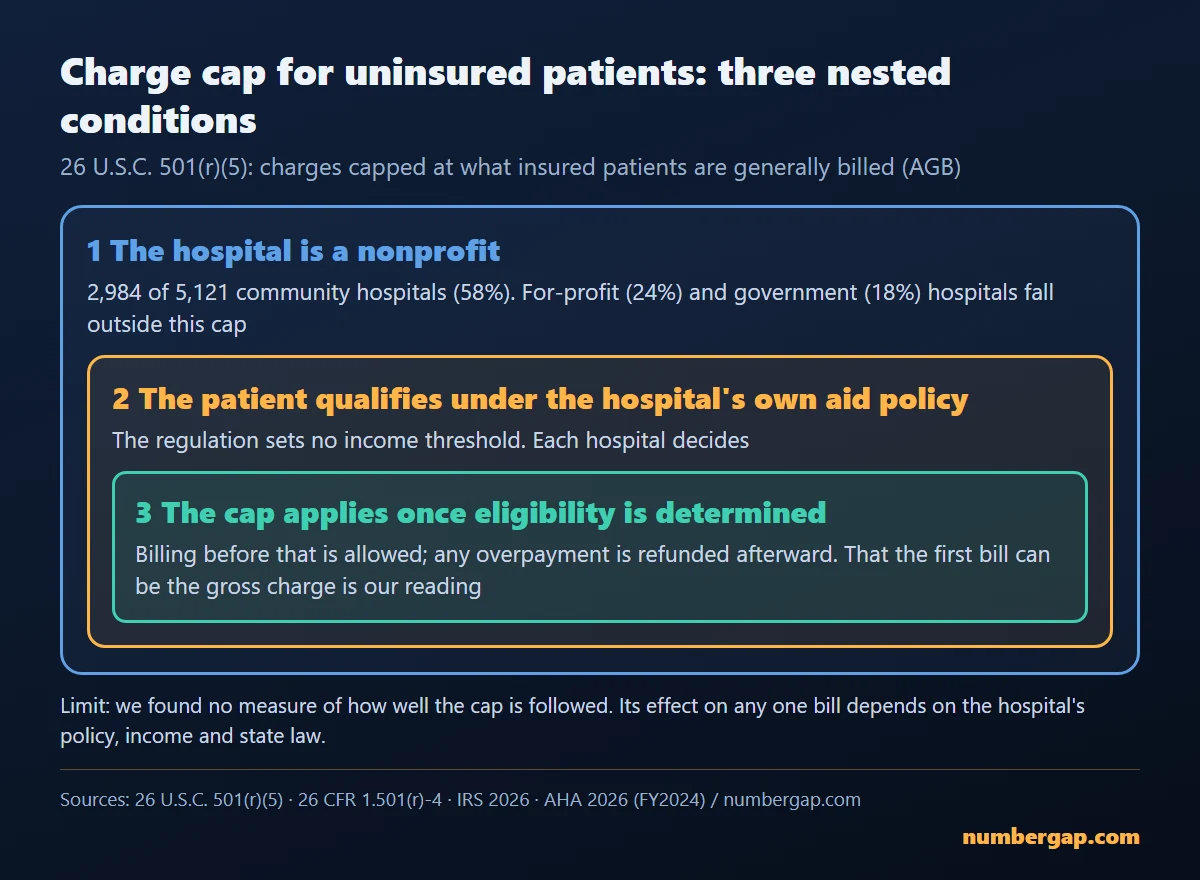
Federal law, 26 U.S.C. 501(r)(5), says a nonprofit hospital keeps its tax-exempt status only if it does two things. It must limit what it charges people eligible under its financial assistance policy to no more than the amounts generally billed to insured patients for emergency or medically necessary care. And it must prohibit the use of gross charges.
Source: 26 U.S.C. §501(r)(5) — statute text
https://www.law.cornell.edu/uscode/text/26/501
The protection has four limits.
- It covers only people who qualify under the hospital's own financial assistance policy. The regulation tells hospitals to state eligibility criteria and whether help is free or discounted. It sets no income threshold. Each hospital decides.
- It applies only to nonprofit hospitals. In the American Hospital Association's FY2024 survey, 2,984 of 5,121 community hospitals (58%) were nonprofit, 1,224 (24%) were investor-owned and 913 (18%) were state or local government. For-profit and government hospitals fall outside this federal cap.
- Billing before eligibility is settled is allowed. Under the IRS safe harbor, a hospital may bill above the cap before it determines eligibility, as long as it refunds any overpayment afterward. Our reading: the first bill can legally be the gross-charge bill.
- We found no measure of how well the cap is followed. There is no published compliance rate for 501(r)(5) itself. So "X% of nonprofit hospitals violate it" cannot be written.
Source: 26 CFR 1.501(r)-4 — regulation text
https://www.law.cornell.edu/cfr/text/26/1.501(r)-4
Source: IRS, "Limitation on charges - Section 501(r)(5)," last reviewed July 3, 2026 — federal agency guidance
https://www.irs.gov/charities-non-profits/limitation-on-charges-section-501r5
Source: American Hospital Association, "Fast Facts on U.S. Hospitals, 2026" (FY2024 survey) — counts from the industry trade group's own survey
https://www.aha.org/system/files/media/file/2026/02/Fast-Facts-on-US-Hospitals-2026-Infographics.pdf
Maryland put numbers in statute. Its Health-General section 19-214.1 requires every hospital under HSCRC's jurisdiction to provide free medically necessary care to patients with family income at or below 200% of the federal poverty level. For patients in financial hardship (medical debt above 25% of family income) with income below 500% of poverty, the law sets minimum cuts to out-of-pocket costs, from 75% at 201 to 250% of poverty down to 35% at 451 to 500%. Federal law leaves those cutoffs to each hospital.
Source: Maryland Health-General §19-214.1 (2026 session text) — state statute text
https://mgaleg.maryland.gov/2026RS/Statute_Web/ghg/19-214.1.pdf
What about posted cash prices? In the 2023 study above, cash prices averaged 64% of the chargemaster price. They were lower than the median commercial negotiated rate 47% of the time. Read that carefully: a posted self-pay price is, on average, about a third below the list price, but more than half the time it was no lower than the insurers' median negotiated rate. The study covers 70 outpatient-type services, and a posted price is not the same as a bill that was actually sent.
What did uninsured patients actually get billed? In 2007, Gerard Anderson, a Johns Hopkins researcher, reported in Health Affairs, using 2004 data, that rates charged to many uninsured and self-pay patients "were often 2.5 times what most health insurers actually paid and more than three times the hospital's Medicare-allowable costs." In a 2015 paper with Ge Bai, using 2012 data, the authors wrote that "uninsured patients are commonly asked to pay the full charges."
Those are 2004 and 2012 data. We could not find a current, nationally representative measure of how many uninsured patients are billed full chargemaster prices. Not finding it does not mean it is rare.
Source: Anderson GF, "From 'soak the rich' to 'soak the poor': recent trends in hospital pricing," Health Affairs 2007;26(3):780-9 — read through the PubMed abstract
https://pubmed.ncbi.nlm.nih.gov/17485757/
Source: Bai G, Anderson GF, Health Affairs 2015;34(6):922-8 — read through the PubMed abstract. The authors' statement, using 2012 data
https://pubmed.ncbi.nlm.nih.gov/26056196/
Hospitals are also required to post their prices. Since Jan. 1, 2021, every U.S. hospital must post a machine-readable file of all items and services and a consumer-friendly list of shoppable services. How well is that followed?
We downloaded all 13,355 rows of CMS's enforcement data. From January 2021 through July 2026, CMS recorded 3,646 warning notices and 29 civil monetary penalty notices. Those penalties went to 28 hospitals. One got two.
We checked one number against another source. In October 2024 the GAO reported that CMS had issued over $4 million in penalties to 14 hospitals in 2021 to 2023. In our count, 14 hospitals had received penalty notices through 2023. Two independent counts matched. We do not cite individual penalty amounts. They appear neither in the CMS data nor on its public list.
Few penalties do not mean broad compliance. In November 2024, the HHS Office of Inspector General reviewed a stratified random sample of 100 hospitals. 63 complied. 37 did not. OIG estimated that about 46% of the 5,879 hospitals required to comply did not meet the requirements.
The advocacy group PatientRightsAdvocate.org said in September 2026 that 988 of 2,000 hospitals (49.4%) were fully compliant. That is an advocacy group's report, its method is only partly described, and the Wisconsin Hospital Association called it "flawed." OIG's figure and the group's differ in year, definition and sample. They should not be stitched into a trend.
Source: CMS Hospital Price Transparency Enforcement Activities and Outcomes (July 2026 file), our own aggregation — federal agency data
https://data.cms.gov/data-api/v1/dataset/6a3aa708-3c9d-411a-a1a4-e046d3ade7ef/data
Source: GAO-25-106995, Oct. 2, 2024; HHS OIG A-07-22-06108, Nov. 5, 2024 — government audit reports
https://www.gao.gov/products/gao-25-106995
https://oig.hhs.gov/reports/all/2024/not-all-selected-hospitals-complied-with-the-hospital-price-transparency-rule
Source: PatientRightsAdvocate.org, Eighth Hospital Price Transparency Compliance Report, Sept. 2026 — advocacy group report; method not fully disclosed
https://www.patientrightsadvocate.org/eighth-annual-hospital-price-transparency-compliance-report-september-2026
That is as far as the law and the data confirm. How much any individual patient could reduce a bill under these rules depends on the hospital's policy, the patient's income and state law. This post cannot judge that.
Frequently Asked Questions
Q. Do I have to pay the full amount on a hospital bill?
A. The number on a bill and the money that changes hands can differ a lot. In Medicare inpatient data, billed charges ran about five times payments. But that file has no privately insured or uninsured patients. What a specific patient owes depends on insurance contracts for the insured and on the hospital's financial assistance policy and state law for the uninsured. This post does not judge any individual bill. Ask the hospital's billing office or your insurer about yours.
Q. What is a chargemaster?
A. It is a hospital's list price for every item and service. Federal regulation defines a gross charge as the charge on the chargemaster before any discounts. Insurers often negotiate a standing percentage off it, and Medicare pays by formula rather than by this list.
Q. Why do hospitals bill more than they get paid?
A. The explanations conflict. The HSCRC says hospitals mark up charges to cover uncompensated care, large-HMO discounts and low Medicare and Medicaid payments. RAND's briefing says public-payer share is not correlated with relative prices, finds no evidence of cost shifting, and says market power explains 18% of price variation. Which is right has not been settled.
Q. Are hospital price lists accurate?
A. Not always. Since 2021 hospitals must post prices, but a 2024 HHS OIG review of a 100-hospital sample estimated that about 46% of the 5,879 required hospitals did not meet the requirements. CMS has issued penalty notices to 28 hospitals. An advocacy group's 2026 survey, whose method is only partly described, found 49.4% of 2,000 hospitals fully compliant.
Q. Does the No Surprises Act cap what hospitals charge?
A. No. It protects insured people from unexpected out-of-network bills for emergency care, for out-of-network providers at in-network facilities, and for air ambulances. Ground ambulances are generally not covered, and the Act does not regulate prices such as chargemaster rates, in-network prices or deductibles. For uninsured patients, the tool is the good faith estimate: you may be able to dispute a bill that is at least $400 more than the estimate. That is a process, not a price cap. (CMS, updated Oct. 1, 2026)
Q. How much medical debt do Americans owe?
A. It depends on the definition. $88 billion was medical bills on credit records as of June 2021 (CFPB, 2022). $49 billion, from CFPB's January 2025 final rule, was medical bills remaining on credit reports after the bureaus removed some items. A court vacated that rule on July 11, 2025. At least $220 billion is a lower bound for medical bills adults owed in December 2021, from a KFF and Peterson analysis of Census survey data. None of these numbers counts hospital debt alone.
Q. Is hospital care in Maryland cheaper than in other states?
A. This post cannot say. A ratio of 1.11 means the bill is close to the payment. It does not mean the price level is low. The evidence on price levels is contested. We also did not read the low ratios at safety-net hospitals elsewhere as "cheap." The CMS data dictionary's definition of total payment includes indirect medical education (IME) payments to teaching hospitals and disproportionate share (DSH) payments to hospitals serving many low-income patients, so those extra payments are inside the lower ratios. How much of the gap they explain, we could not confirm.
What should you check the next time you see a hospital bill number?
Three questions are worth asking first.
- Is the number the billed charge, the amount the insurer allowed, or what was actually paid?
- Was the patient insured, and under what contract?
- Which year, and which hospital's average, is it?
Billed, allowed, paid. Knowing which of those a number is changes how the story reads.
This post checks public data and statutes. It is not medical, legal or financial advice. For your own bill, ask the hospital billing office or your insurer. Laws and figures are as of Oct. 27, 2026.
Thanks for reading. We will see you in the next post.


Comments
Post a Comment