Average Rent by State: Why Sources Say $1,371 or $1,932
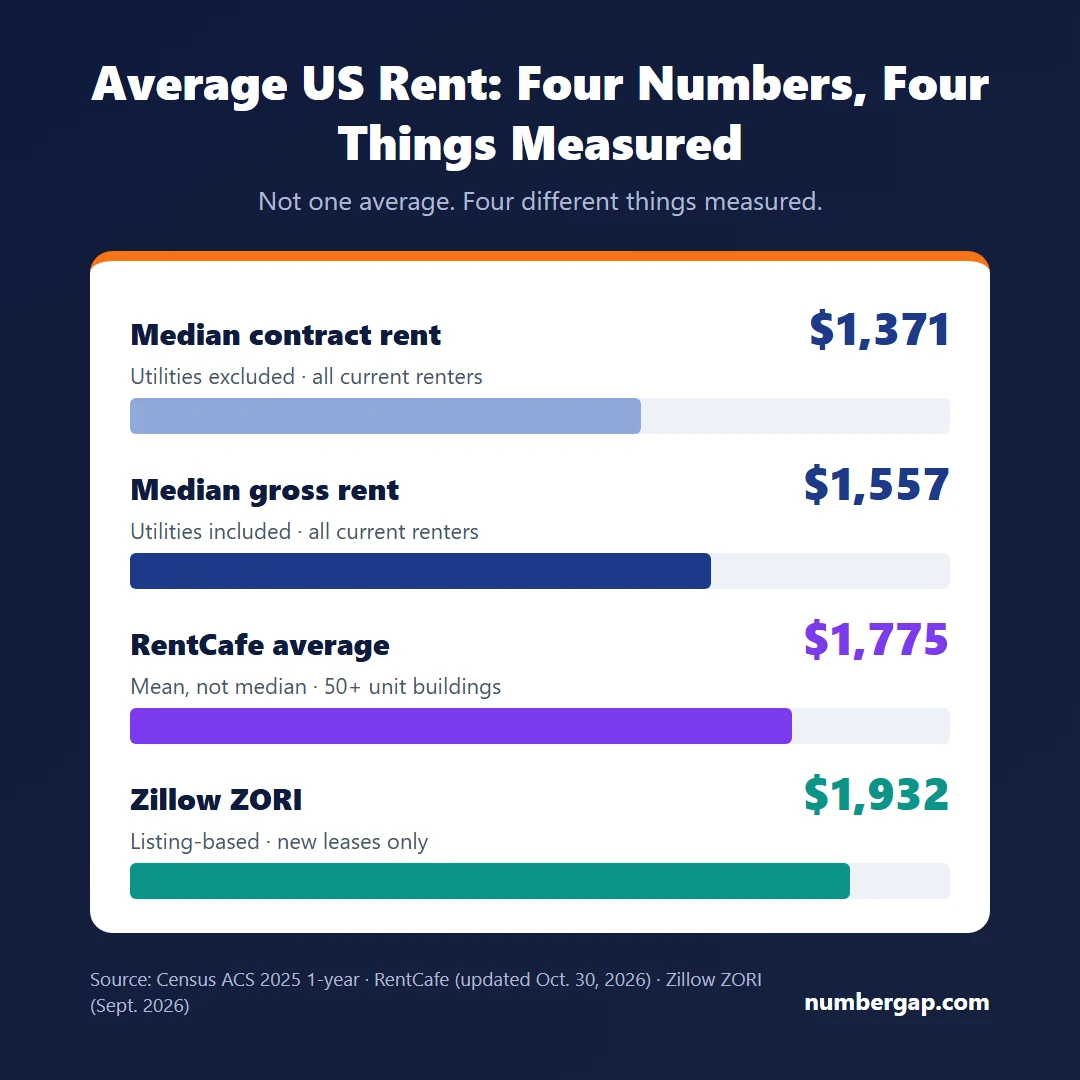
Search "average rent in the US" and you get four different answers.
$1,371. $1,557. $1,775. $1,932.
Last updated: 8 November 2026 · Figures and rules in this post are current as of this date.
None of them is wrong. They measure four different things, and most pages that quote them do not say which.
I opened each source to find out what it counts. Then I split the Census data into the 50 states and DC, and one comparison stopped me.
New York and Utah.
As of Nov. 8, 2026. Census figures are ACS 2025 1-year estimates, Zillow figures are for September 2026, and RentCafe's figure was updated Oct. 30, 2026.
What is the average rent in the US? Four numbers, four things measured
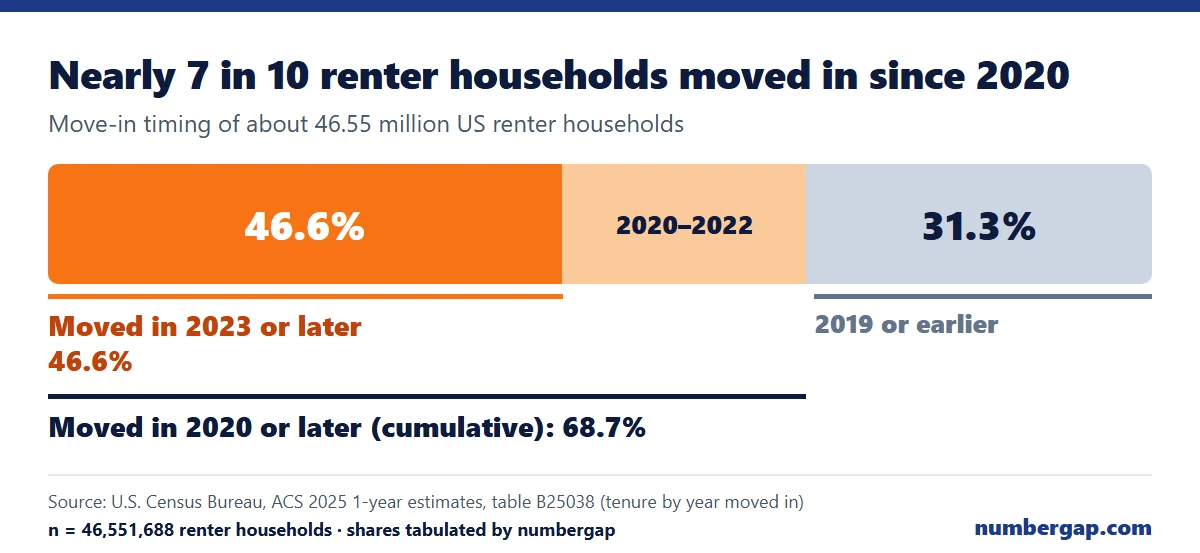
The four numbers differ in what they count, whose rent they count, and when. This table puts each one next to its definition.
| Number | What it measures | Whose rent | As of |
|---|---|---|---|
| $1,371 | Median contract rent (utilities excluded) | All current renters | ACS 2025 |
| $1,557 | Median gross rent (contract rent plus estimated utilities) | All current renters | ACS 2025 |
| $1,775 | Average, not median. Apartment buildings with 50+ units only | Building-level data. Does not say whether asking or effective rent | Updated Oct. 30, 2026 |
| $1,932 | Rent index built from listings (Zillow ZORI) | New leases only. Whether utilities are included: could not confirm | Sept. 2026 |
Source: U.S. Census Bureau, ACS 2025 1-year estimates, tables B25113 (median gross rent by year moved in) and B25058 (median contract rent), tabulated by this blog from the raw files — official published data.
https://www2.census.gov/programs-surveys/acs/summary_file/2025/table-based-SF/data/1YRData/
Source: RentCafe, "Average Rent in the U.S.," updated Oct. 30, 2026 — commercial source. Rent data comes from Yardi Matrix, a sister company. It covers "all U.S. apartment buildings with 50 or more units" (23.5 million apartments, 181 markets).
https://www.rentcafe.com/average-rent-market-trends/us/
Source: Zillow Observed Rent Index (ZORI), metro CSV, national series for Sept. 2026 — commercial source. The "new tenants only" description comes from a peer-reviewed paper's online appendix (Adams et al.), not from Zillow. Zillow's own methodology page returned HTTP 403 and I did not get around it.
https://files.zillowstatic.com/research/public_csvs/zori/Metro_zori_uc_sfrcondomfr_sm_month.csv
Census gross rent includes utilities. Its definition reads:
"the contract rent plus the estimated average monthly cost of utilities (electricity, gas, and water and sewer) and fuels"
Source: U.S. Census Bureau, ACS 2025 Subject Definitions — official definition text.
So the $186 gap between $1,371 and $1,557 is the distance between two medians for the same group of current renters, measured two ways. You can compare those two.
You cannot compare an advertised rent without utilities to a gross rent with them.
One more note on words. This post uses medians because Census publishes medians. Only RentCafe's $1,775 is a true average.
Do people who just moved in pay more than long-time renters?
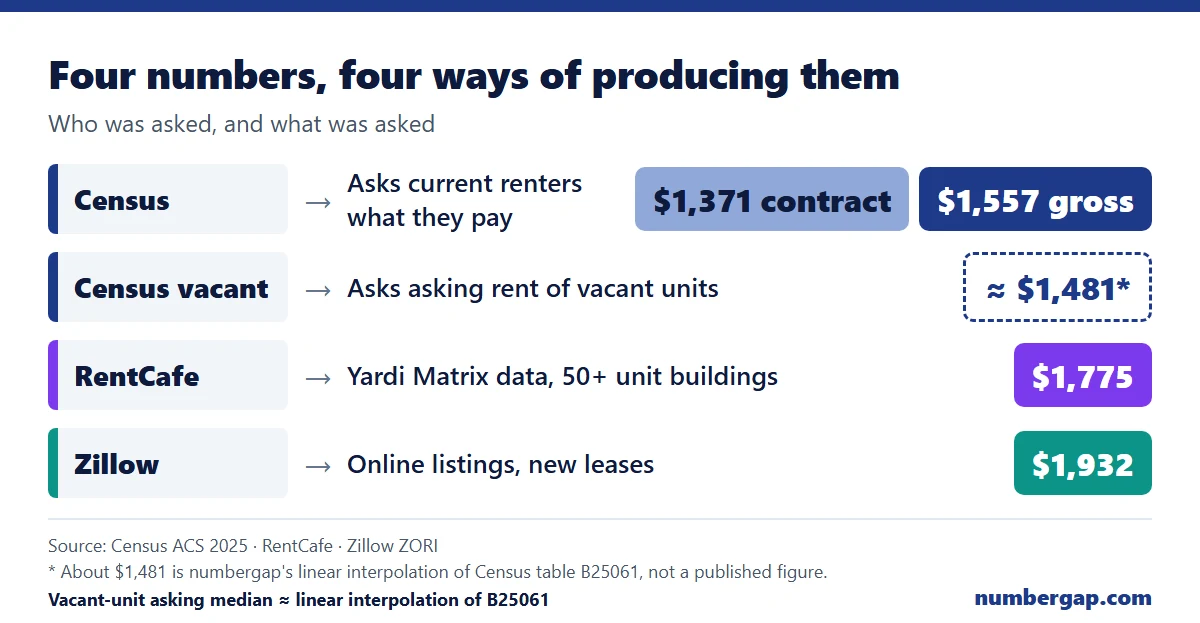
Yes. Renters who moved in during 2023 or later pay a median gross rent of $1,686. That is $129 and 1.083 times the all-renter median of $1,557.
Renters who have lived in their homes since 1989 or earlier pay $1,123.
Line them up by move-in year and you get a staircase.
| Moved in | Median gross rent |
|---|---|
| 2023 or later | $1,686 |
| 2020 to 2022 | $1,579 |
| 2010 to 2019 | $1,376 |
| 2000 to 2009 | $1,246 |
| 1990 to 1999 | $1,211 |
| 1989 or earlier | $1,123 |
| All renters | $1,557 |
Source: U.S. Census Bureau, ACS 2025 1-year estimates, table B25113 — official published data. "Year moved in" is the year the householder most recently moved into the unit. Moving within the same building counts as a new unit.
From the longest-staying renters to the newest, the gap is $563. About 1.5 times.
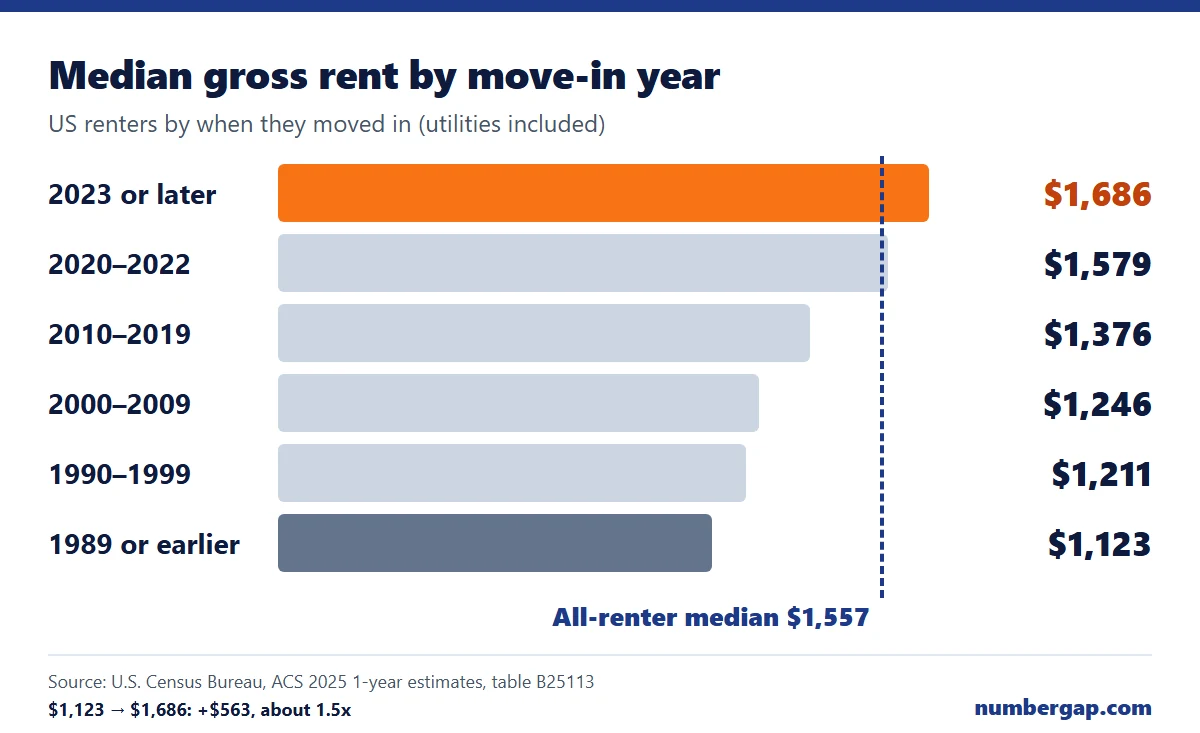
One caution. "Moved in 2023 or later" covers up to about three years of arrivals in the 2025 survey. It is not what someone signing a lease today pays.
It is still a big group. Of about 46.55 million renter households, 46.6% moved in during 2023 or later. Widen it to 2020 or later and the share is 68.7%.
Source: U.S. Census Bureau, ACS 2025 1-year estimates, table B25038 (tenure by year moved in) — official published data. Shares tabulated by this blog.
Nearly seven in ten renter households moved in since 2020. The national "average" blends in a lot of older leases.
But $129 is one national number. Break it out by state and the picture changes.
Which states charge new tenants the most extra?
Massachusetts and New York, by a wide margin. Utah and Nevada barely charge extra at all.
First I looked for the opposite case: any state where new arrivals pay less than the all-renter median.
I went through all 51 rows.
There is none. In every state and in DC, the 2023-or-later median is higher.
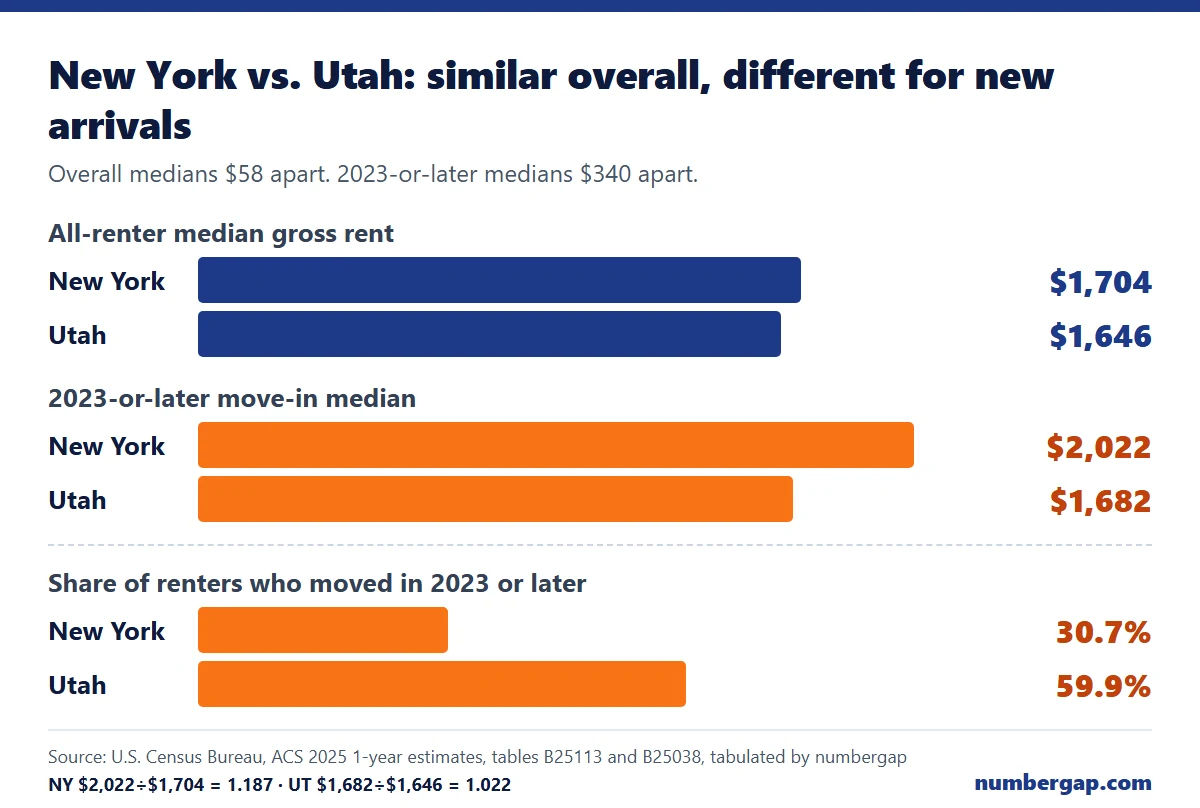
The difference is in the size. Put New York next to Utah.
| New York | Utah | |
|---|---|---|
| All-renter median gross rent | $1,704 | $1,646 |
| 2023-or-later move-in median | $2,022 | $1,682 |
| Difference | +$318 | +$36 |
| Ratio | 1.187 | 1.022 |
| Share of renters who moved in 2023 or later | 30.7% | 59.9% |
The all-renter medians are $58 apart. Close to the same level. For someone who just moved in, the gap is $340.
In New York, about three in ten renters moved in during the last three years. In Utah, about six in ten. New York has the lowest share of the 51, and Utah the highest.
Source: U.S. Census Bureau, ACS 2025 1-year estimates, tables B25113 and B25038, tabulated by this blog — official published data. Ratio = 2023-or-later median divided by all-renter median.
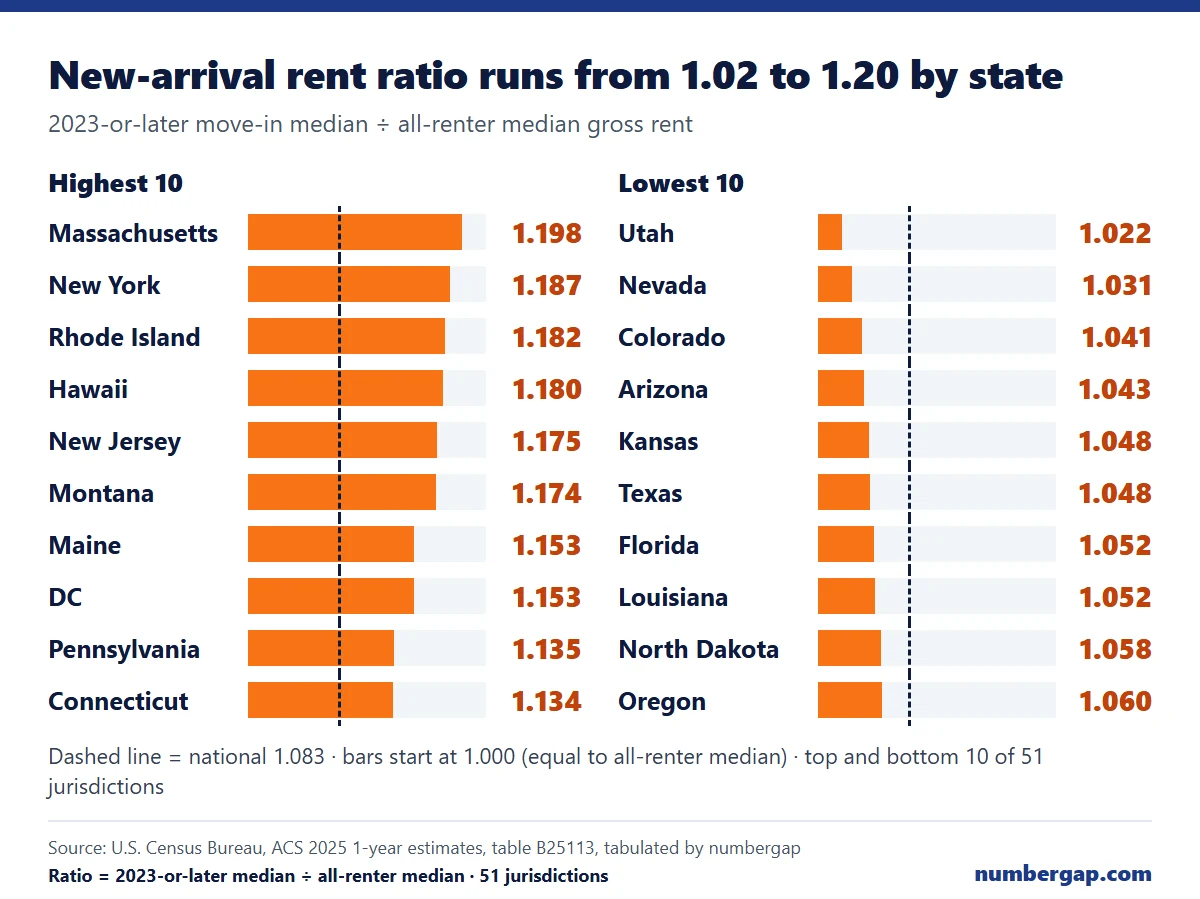
Here are the two ends of the ranking.
| State | Ratio | Dollar gap | Share who moved in 2023 or later | |
|---|---|---|---|---|
| Highest | Massachusetts | 1.198 | +$389 | 41.3% |
| New York | 1.187 | +$318 | 30.7% | |
| Rhode Island | 1.182 | +$279 | 35.7% | |
| Hawaii | 1.180 | +$362 | 43.9% | |
| New Jersey | 1.175 | +$330 | 35.3% | |
| Lowest | Utah | 1.022 | +$36 | 59.9% |
| Nevada | 1.031 | +$53 | 50.8% | |
| Colorado | 1.041 | +$75 | 59.8% | |
| Arizona | 1.043 | +$73 | 55.8% | |
| Texas | 1.048 | +$73 | 58.3% |
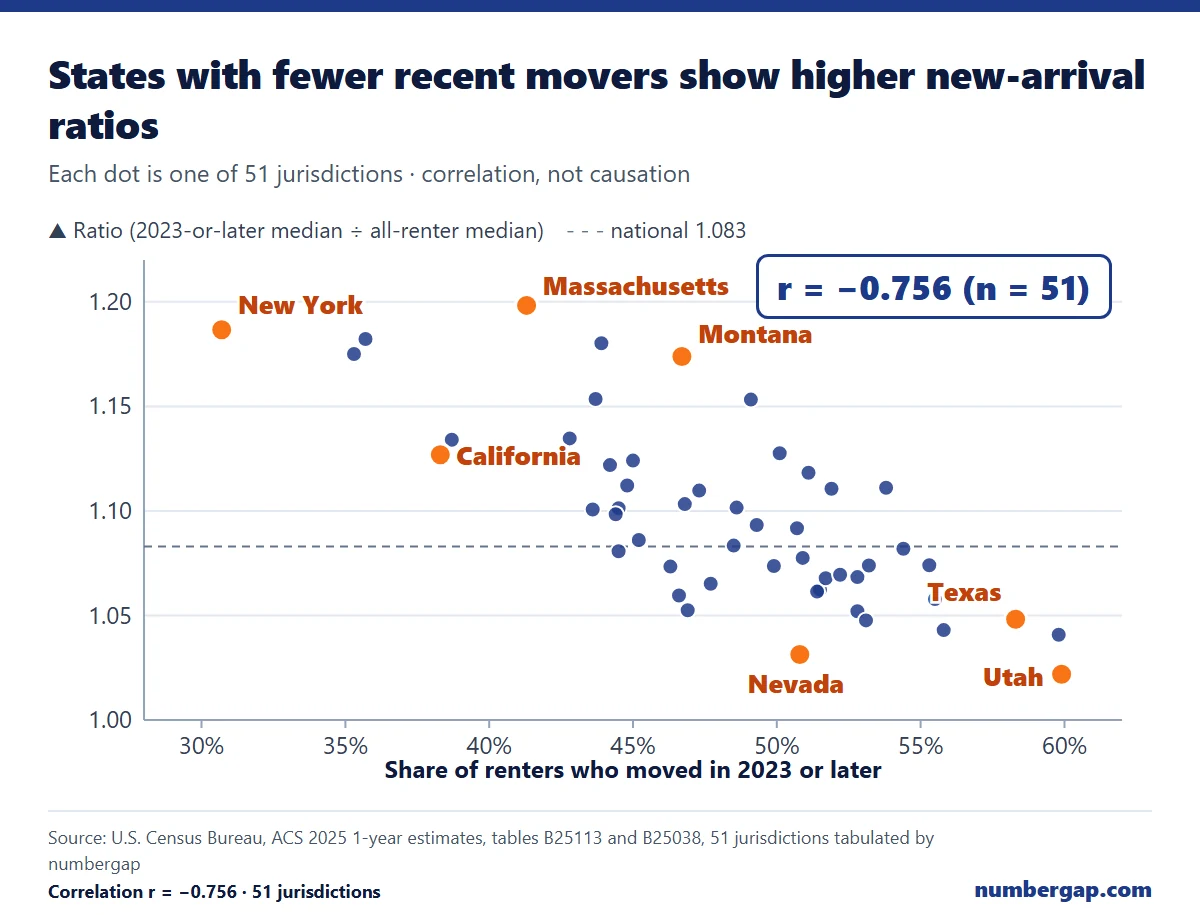
Now plot all 51 as dots. Share of recent movers runs along the bottom, the ratio up the side. The dots slope down to the right. The correlation is −0.756.
States where people move a lot show a small new-tenant premium. States where people stay put show a large one.
This is not simply a story about expensive states. The correlation between a state's rent level and its ratio is 0.253, which is weak.
California has the highest median ($2,160) and ranks 12th of 51 on the ratio (1.127). Montana ranks 34th on rent level ($1,208) and 6th on the ratio (1.174).
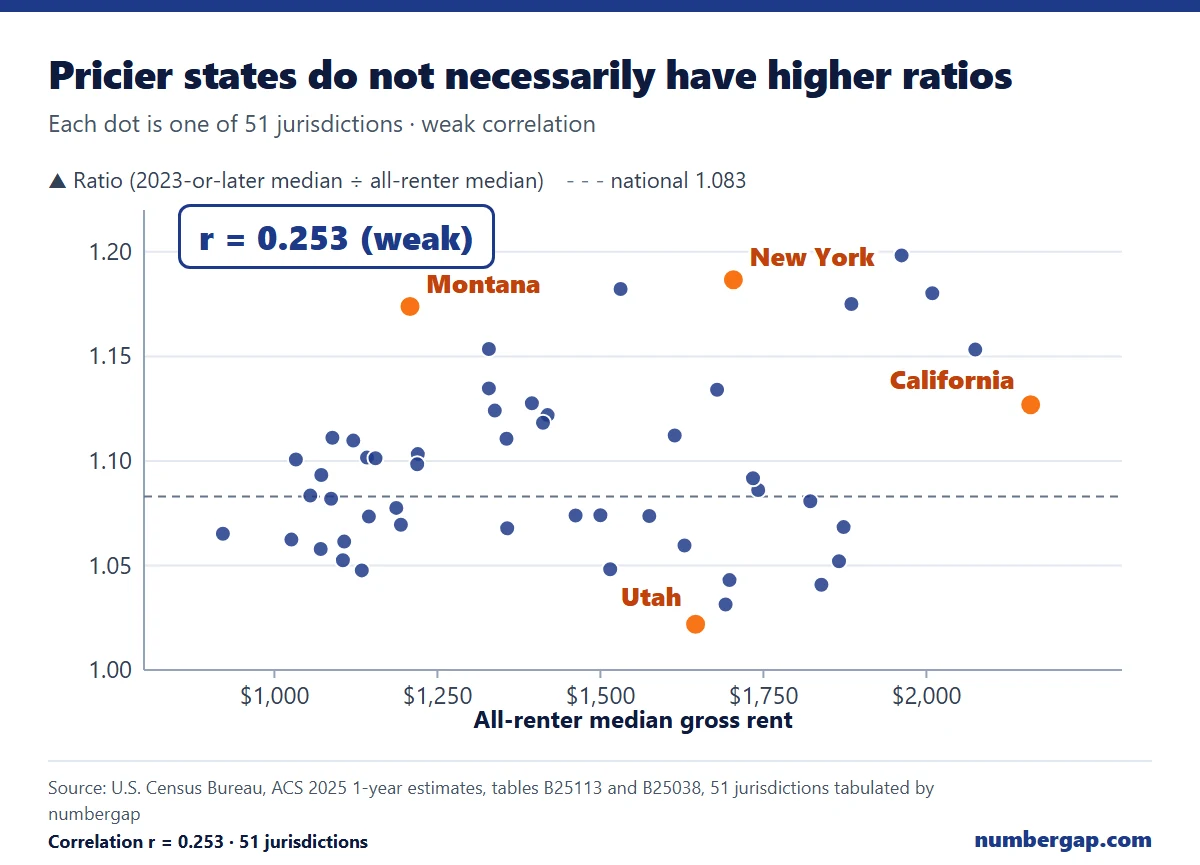
Source: U.S. Census Bureau, ACS 2025 1-year estimates, tables B25113 and B25038. Rankings and correlations computed by this blog across the 51 jurisdictions — derived from official published data.
There is a catch in that correlation.
When few renters are recent arrivals, the all-renter median gets pulled toward old leases. That shrinks the denominator and pushes the ratio up. Part of the pattern is built into the arithmetic. So I do not write that long stays cause the gap. The two move together, and that is as far as the data goes.
There are exceptions too. Montana's share of recent movers is 46.7%, almost exactly the national 46.6%, yet its ratio ranks 6th. Montana also has wide survey error (±$43 on the all-renter median, ±$59 on the recent-mover median). Utah's +$36 is larger than the margin of error on its recent-mover median (±$28), but I did not run a formal significance test.
Median rent by state: all 50 states and DC, highest to lowest
California is highest at $2,160 and West Virginia lowest at $921, about 2.3 times apart.
The table ranks the median gross rent (utilities included) of all current renters. Maine and Pennsylvania tie at $1,329, so both are shown as 30th.
| Rank | State | All-renter median gross rent | 2023-or-later move-in median | Ratio |
|---|---|---|---|---|
| 1 | California | $2,160 | $2,434 | 1.127 |
| 2 | District of Columbia | $2,075 | $2,393 | 1.153 |
| 3 | Hawaii | $2,009 | $2,371 | 1.180 |
| 4 | Massachusetts | $1,962 | $2,351 | 1.198 |
| 5 | New Jersey | $1,885 | $2,215 | 1.175 |
| 6 | Washington | $1,873 | $2,001 | 1.068 |
| 7 | Florida | $1,866 | $1,963 | 1.052 |
| 8 | Colorado | $1,839 | $1,914 | 1.041 |
| 9 | Maryland | $1,822 | $1,969 | 1.081 |
| 10 | New Hampshire | $1,742 | $1,892 | 1.086 |
| 11 | Virginia | $1,734 | $1,893 | 1.092 |
| 12 | New York | $1,704 | $2,022 | 1.187 |
| 13 | Arizona | $1,698 | $1,771 | 1.043 |
| 14 | Nevada | $1,692 | $1,745 | 1.031 |
| 15 | Connecticut | $1,679 | $1,904 | 1.134 |
| 16 | Utah | $1,646 | $1,682 | 1.022 |
| 17 | Oregon | $1,629 | $1,726 | 1.060 |
| 18 | Delaware | $1,614 | $1,795 | 1.112 |
| 19 | Georgia | $1,575 | $1,691 | 1.074 |
| 20 | Rhode Island | $1,531 | $1,810 | 1.182 |
| 21 | Texas | $1,515 | $1,588 | 1.048 |
| 22 | Alaska | $1,500 | $1,611 | 1.074 |
| 23 | Idaho | $1,462 | $1,570 | 1.074 |
| 24 | Illinois | $1,419 | $1,592 | 1.122 |
| 25 | North Carolina | $1,412 | $1,579 | 1.118 |
| 26 | South Carolina | $1,395 | $1,573 | 1.128 |
| 27 | Minnesota | $1,357 | $1,449 | 1.068 |
| 28 | Tennessee | $1,356 | $1,506 | 1.111 |
| 29 | Vermont | $1,338 | $1,504 | 1.124 |
| 30 | Maine | $1,329 | $1,533 | 1.153 |
| 30 | Pennsylvania | $1,329 | $1,508 | 1.135 |
| 32 | Michigan | $1,220 | $1,346 | 1.103 |
| 33 | Wisconsin | $1,219 | $1,339 | 1.098 |
| 34 | Montana | $1,208 | $1,418 | 1.174 |
| 35 | Nebraska | $1,194 | $1,277 | 1.070 |
| 36 | Indiana | $1,187 | $1,279 | 1.078 |
| 37 | Ohio | $1,155 | $1,272 | 1.101 |
| 38 | New Mexico | $1,145 | $1,229 | 1.073 |
| 39 | Missouri | $1,142 | $1,258 | 1.102 |
| 40 | Kansas | $1,134 | $1,188 | 1.048 |
| 41 | Alabama | $1,121 | $1,244 | 1.110 |
| 42 | Oklahoma | $1,107 | $1,175 | 1.061 |
| 43 | Louisiana | $1,105 | $1,163 | 1.052 |
| 44 | South Dakota | $1,089 | $1,210 | 1.111 |
| 45 | Wyoming | $1,087 | $1,176 | 1.082 |
| 46 | Kentucky | $1,072 | $1,172 | 1.093 |
| 47 | North Dakota | $1,071 | $1,133 | 1.058 |
| 48 | Arkansas | $1,055 | $1,143 | 1.083 |
| 49 | Mississippi | $1,033 | $1,137 | 1.101 |
| 50 | Iowa | $1,026 | $1,090 | 1.062 |
| 51 | West Virginia | $921 | $981 | 1.065 |
| United States | $1,557 | $1,686 | 1.083 |
Source: U.S. Census Bureau, ACS 2025 1-year estimates, table B25113, "Median Gross Rent by Year Householder Moved Into Unit," tabulated by this blog — official published data. Covers renter households paying cash rent; no-cash-rent units are excluded. This is a sample survey, so every state carries a margin of error, and the smallest states carry the widest.
https://www2.census.gov/programs-surveys/acs/summary_file/2025/table-based-SF/data/1YRData/
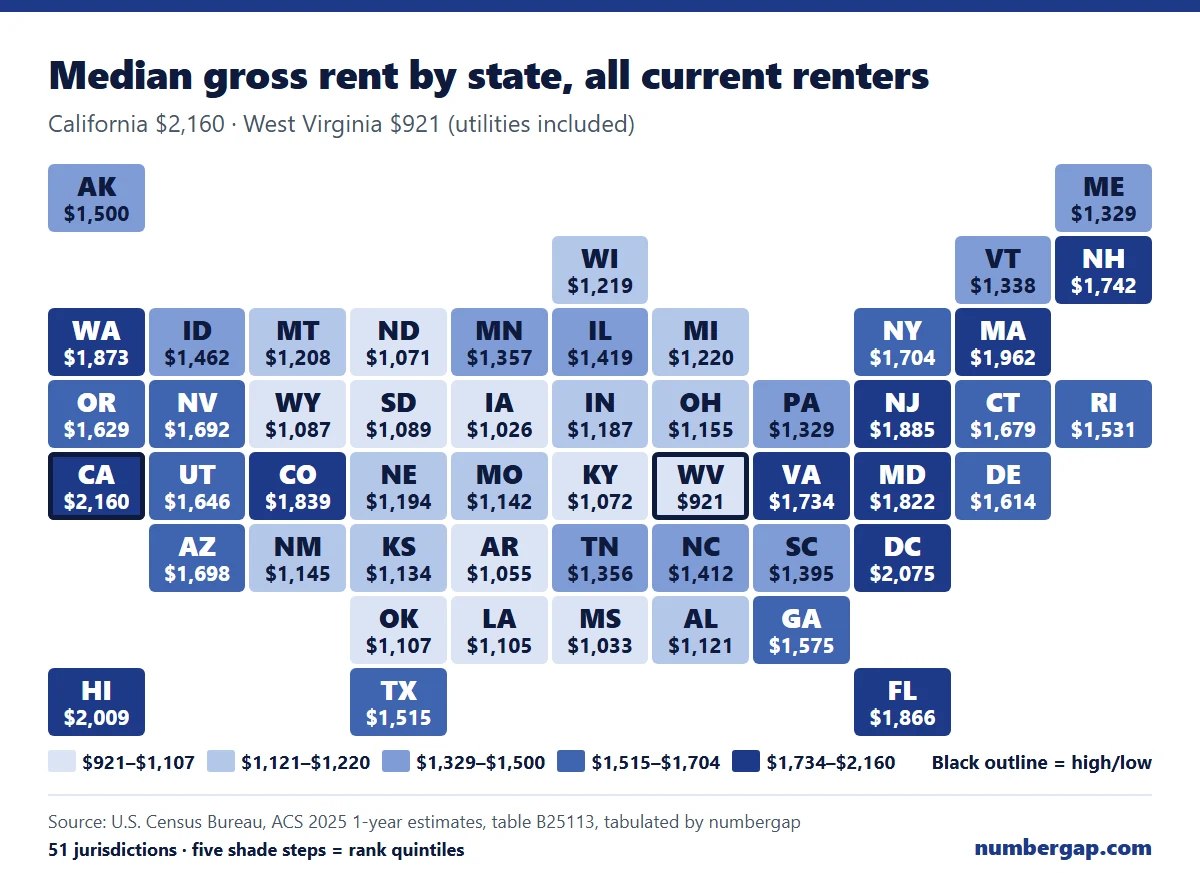
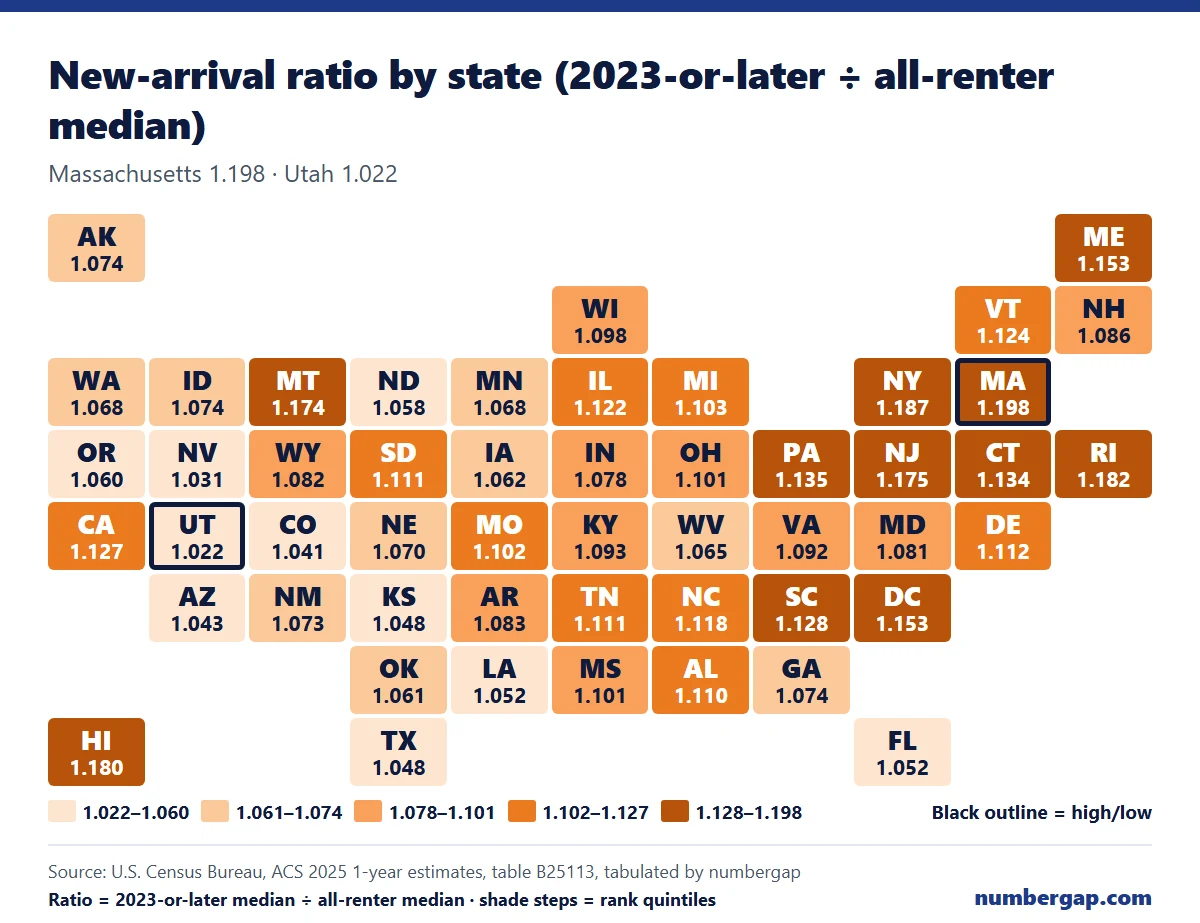
Two rows stand out. New York ranks 12th on rent level and 2nd on the ratio. Utah ranks 16th on rent level and 51st on the ratio, the lowest.
Do Zillow listings point the same way?
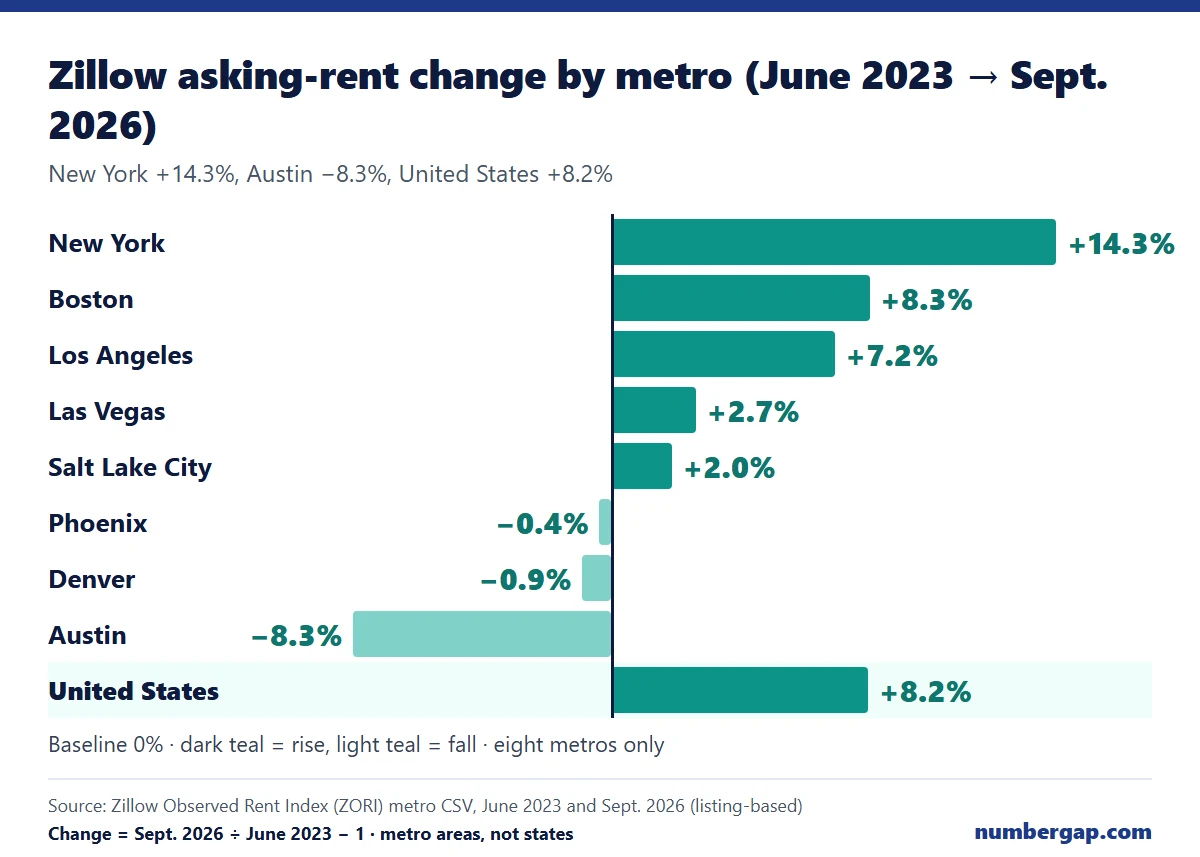
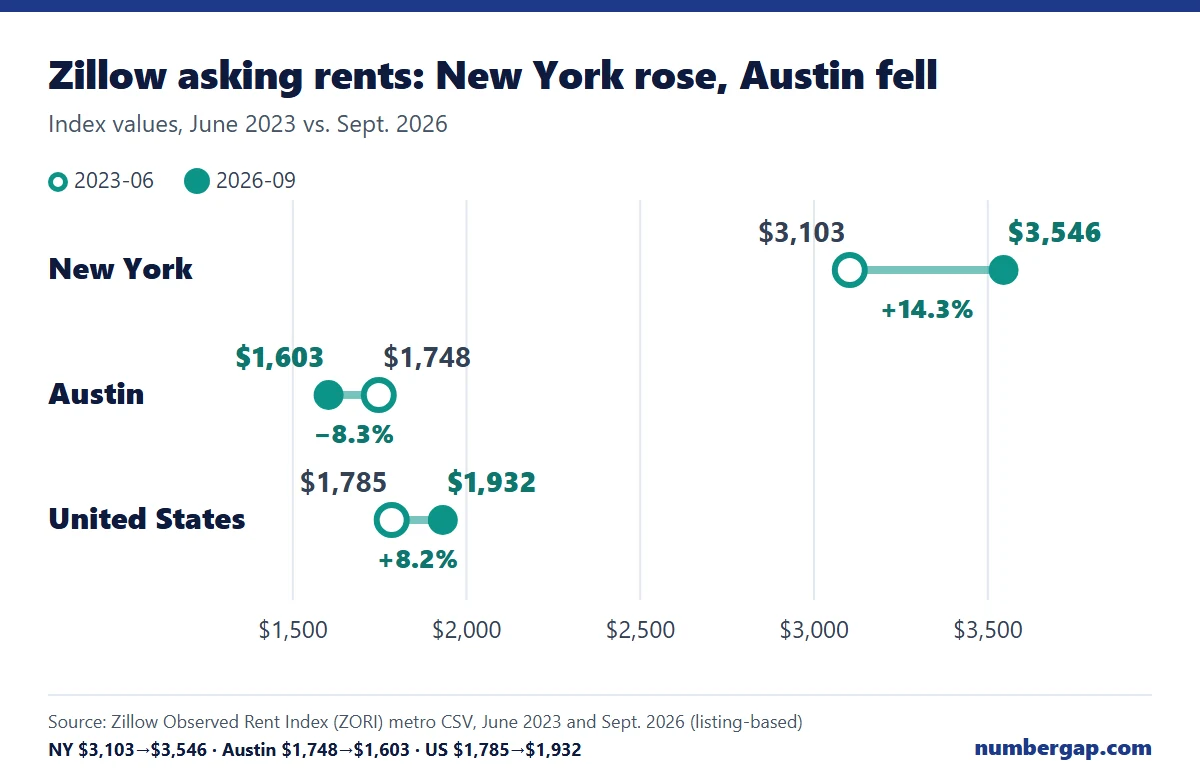
Broadly, yes. Zillow's asking-rent index rose 14.3% in New York and fell 8.3% in Austin between June 2023 and September 2026.
States (ACS) and metro areas (Zillow) are different geographies. I am not calling them the same places. The point is that a different route shows new-lease rents moving most in some of the same corners.
| Metro area | June 2023 | Sept. 2026 | Change |
|---|---|---|---|
| New York | $3,103 | $3,546 | +14.3% |
| Boston | $2,759 | $2,987 | +8.3% |
| Los Angeles | $2,733 | $2,929 | +7.2% |
| Las Vegas | $1,686 | $1,732 | +2.7% |
| Salt Lake City | $1,612 | $1,644 | +2.0% |
| Phoenix | $1,727 | $1,720 | −0.4% |
| Denver | $1,917 | $1,900 | −0.9% |
| Austin | $1,748 | $1,603 | −8.3% |
| United States | $1,785 | $1,932 | +8.2% |
Source: Zillow Observed Rent Index (ZORI) metro CSV, June 2023 and Sept. 2026 values; percentage changes computed by this blog — commercial source, based on listings. Whether utilities are included: could not confirm.
https://files.zillowstatic.com/research/public_csvs/zori/Metro_zori_uc_sfrcondomfr_sm_month.csv
The New York metro ran well above the national +8.2%. Boston landed close to it. Denver, Phoenix and Austin, which sit in states with some of the smallest ACS ratios (Colorado 1.041, Arizona 1.043, Texas 1.048), were flat or down.
That is eight metros, not the whole map.
Why do long-time tenants pay less?
I did not find one source that pins it down. I did find good research on why rent statistics trail new leases. That research is about how fast rents grow, not about dollar levels, so read it as pointing the same way and nothing more.
Four researchers at the BLS and the Cleveland Fed (Adams, Loewenstein, Montag and Verbrugge) had a puzzle. Rent indexes kept giving different answers. Their conclusion:
"almost entirely explained by differences in rent growth for new tenants relative to the average rent growth for all tenants"
Source: Adams, Loewenstein, Montag and Verbrugge, "Disentangling Rent Index Differences: Data, Methods, and Scope," BLS working paper — government research paper (dated 2022 by its URL path). It studies rent growth indexes, not dollar levels.
https://www.bls.gov/osmr/research-papers/2022/pdf/ec220100.pdf
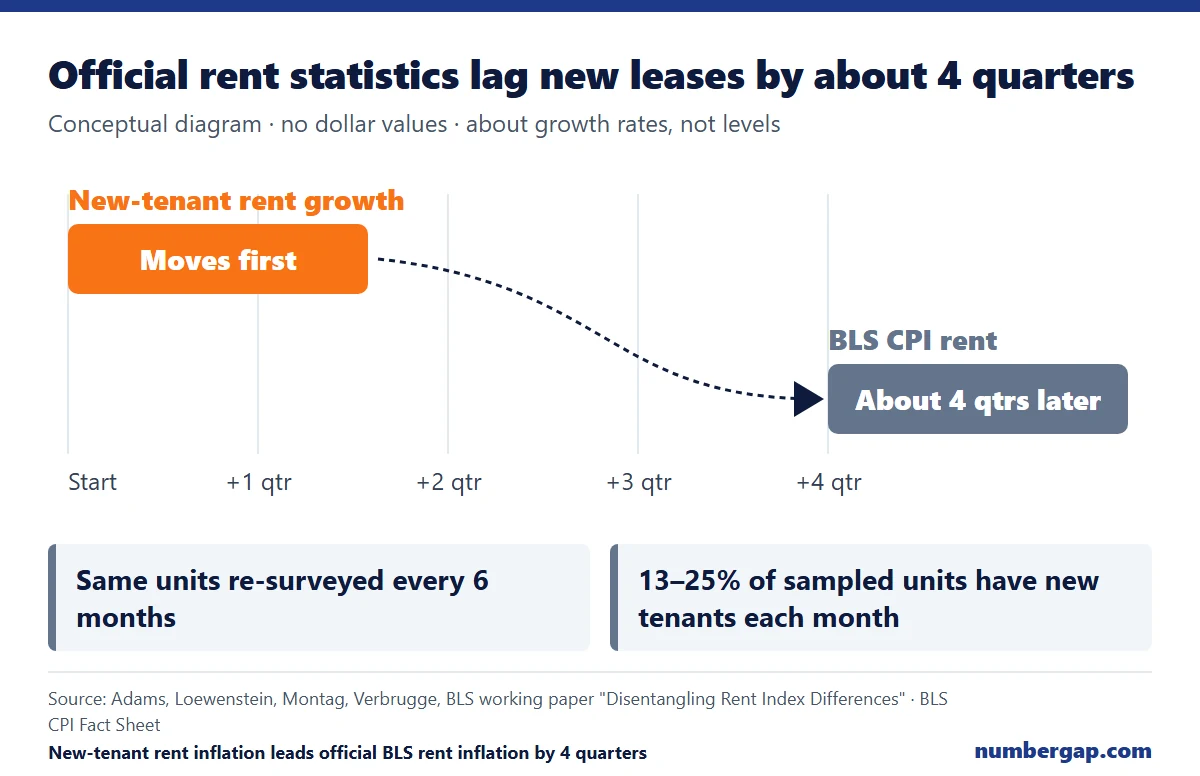
The official CPI rent measure is built differently. BLS picks a sample of housing units and collects rent from each one "every 6 months." It divides this month's average rent by the average from six months earlier and takes the sixth root to get a one-month change.
Source: BLS, "CPI Fact Sheet: Owners' equivalent rent and rent" — agency documentation.
https://www.bls.gov/cpi/factsheets/owners-equivalent-rent-and-rent.htm
The same paper notes that units "are not necessarily surveyed at the start of leases; many observations are of continuing renters in the middle of a lease or after a lease renewal." In a given month, 13 to 25 percent of sampled units have new tenants.
The result is a lag.
"Rent inflation for new tenants leads the official BLS rent inflation by 4 quarters"
Source: same BLS working paper.
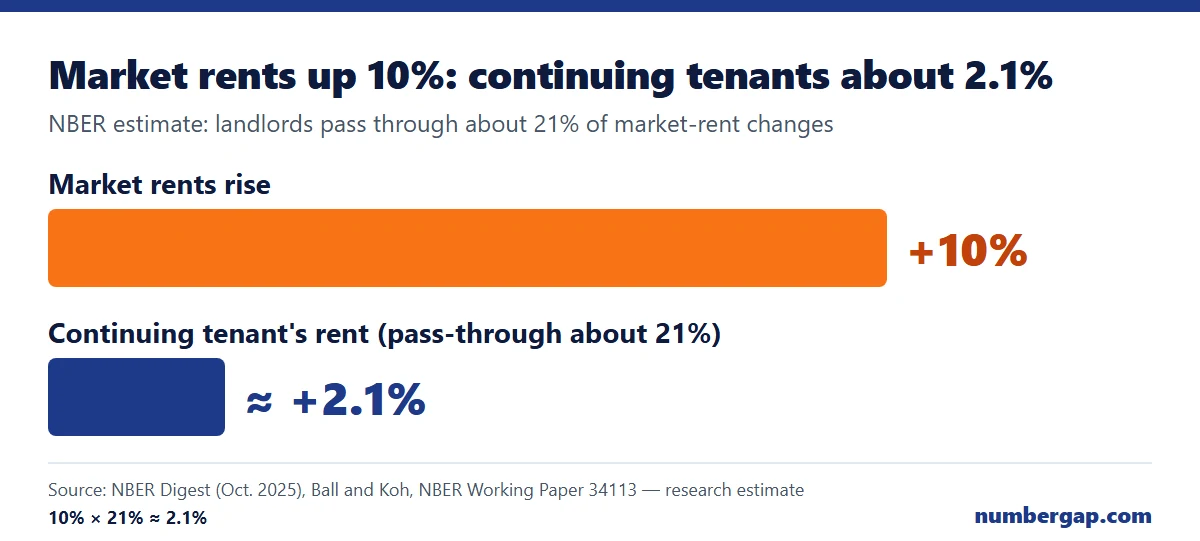
Landlords add their own smoothing. Ball and Koh, in NBER Working Paper 34113, estimate that landlords pass through only about 21% of the change in market rents since a tenant's lease began. A 10% rise in market rents becomes about 2.1% for a continuing tenant. The NBER digest also says roughly 60% of rentals are on 12-month leases, and that the CPI's six-month comparison adds another lag.
Source: NBER Digest, "Understanding the Lag Between CPI Shelter Inflation and Market Rents," October 2025 (summary of NBER Working Paper 34113) — research summary; the 21% is an estimate.
https://www.nber.org/digest/202510/understanding-lag-between-cpi-shelter-inflation-and-market-rents
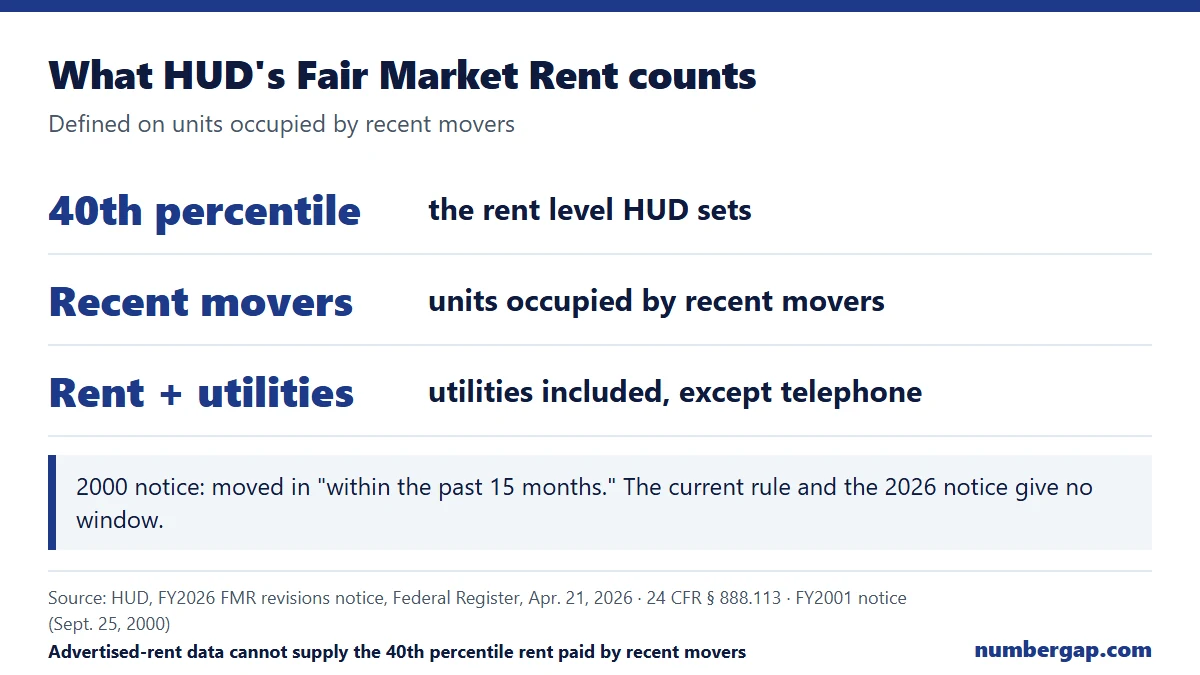
The government faces the same problem. HUD sets Fair Market Rents at the 40th percentile of rents in units "occupied by recent movers," and it counts utilities except telephone. In an April 21, 2026 notice, HUD wrote:
"commercial sources of rent data do not provide an estimate of the 40th percentile rent paid by recent movers"
Advertised-rent data cannot supply the number HUD needs. A 2000 notice defined "recent movers" as people who moved in "within the past 15 months." The current regulation and the 2026 notice give no window.
Source: HUD, FY2026 FMR revisions notice, Federal Register, April 21, 2026, and 24 CFR § 888.113 — federal notice and regulation text. The 15-month window comes from the FY2001 notice (Sept. 25, 2000).
https://www.govinfo.gov/content/pkg/FR-2026-04-21/html/2026-07741.htm
People who move and people who stay are different populations in the data. The people who build the statistics have had to count them separately.
What can't this data tell you?
Here is what I could not confirm, and what I left out.
- Why Zillow's level is above Census. No Zillow statement found. The sources I read say its index covers new tenants only and that MLS listings skew more expensive and newer than newly occupied units. I do not present either as the proven cause.
- Zillow's percentile band. A University of South Florida page says ZORI focuses "on the 35th to 65th percentile." A Northern Kentucky atlas says 40th to 60th. Zillow's own page would not open, so I cannot say which is current.
- Whether Zillow includes utilities. Unconfirmed. That is why $1,932 is never compared directly with $1,557.
- Why the ratio is high in some states. I cannot separate rent regulation from supply or anything else with this data. New York City reports that 41.3% of its 2,323,990 occupied rental units were rent stabilized in the 2023 survey, but that is a city figure and the New York ratio above is statewide. I found no source that tests whether stabilization explains the gap.
- State-level vacant-unit asking rents. I left them out. Twenty-one states are missing from the one-year table, and the states that appear have small samples. The national value, about $1,481, is this blog's own interpolation, not a published number.
- What a lease signed today costs. "Moved in 2023 or later" covers up to about three years.
Source: NYC Rent Guidelines Board, "2026 Housing Supply Report," May 2026 — city agency report, based on the 2023 NYC Housing and Vacancy Survey.
https://rentguidelinesboard.cityofnewyork.us/wp-content/uploads/2026/05/2026-HSR.pdf
Frequently asked questions
Q. What is the average rent in the US?
A. It depends on what is measured: $1,371 (median contract rent, utilities excluded, ACS 2025), $1,557 (median gross rent, utilities included, ACS 2025), $1,775 (RentCafe average, buildings with 50+ units, updated Oct. 30, 2026) or $1,932 (Zillow ZORI, Sept. 2026).
Q. What is the median rent by state, highest to lowest?
A. For all current renters, gross rent runs from $2,160 in California down to $921 in West Virginia. The full 51-row table is above.
Q. Which state has the highest rent?
A. California, at a median gross rent of $2,160. DC is next at $2,075, then Hawaii at $2,009.
Q. Do new tenants pay more rent than people who have lived there for years?
A. In every state and in DC, the median for renters who moved in during 2023 or later is higher than the all-renter median. Nationally it is $1,686 versus $1,557. That group covers up to about three years of arrivals, so it is not the rent on a lease signed today.
Q. Why do sources disagree on average rent?
A. They count different things: contract rent versus gross rent with utilities, all current renters versus new leases versus advertised units, and all rentals versus only large buildings. This post lists each source's definition in the first table.
Q. Why is Zillow's rent higher than Census?
A. I could not confirm a reason. Zillow's methodology page would not open, and I do not know whether its figure includes utilities.
Q. Why does CPI rent lag market rents?
A. A BLS working paper finds new-tenant rent inflation leads the official CPI rent measure by about 4 quarters. The CPI re-surveys the same units every six months, and many observations are renters mid-lease. NBER researchers estimate landlords pass through about 21% of market changes to continuing tenants.
How do you check any rent number before you trust it?
Ask four things. Does it include utilities? Is it a median or an average? Does it count everyone who lives there, new leases only, or advertised units? What month is it from?
If a page does not say, treat its number as a guess and compare it only with numbers measured the same way.
Then ask one more question about your own state. In states where few renters have moved in recently, the national average sits furthest from what a new tenant faces. The data shows that pattern. It does not tell us why.
This post tabulates public Census data and cites regulations and agency papers. It is not legal or financial advice.
If this helped, see you in the next post.


Comments
Post a Comment