How Much Does College Cost? Net Price Excludes F-1 Students
Every net price number the federal government publishes comes with a footnote.
I went looking for it.
Last updated: 5 November 2026 · Figures and rules in this post are current as of this date.
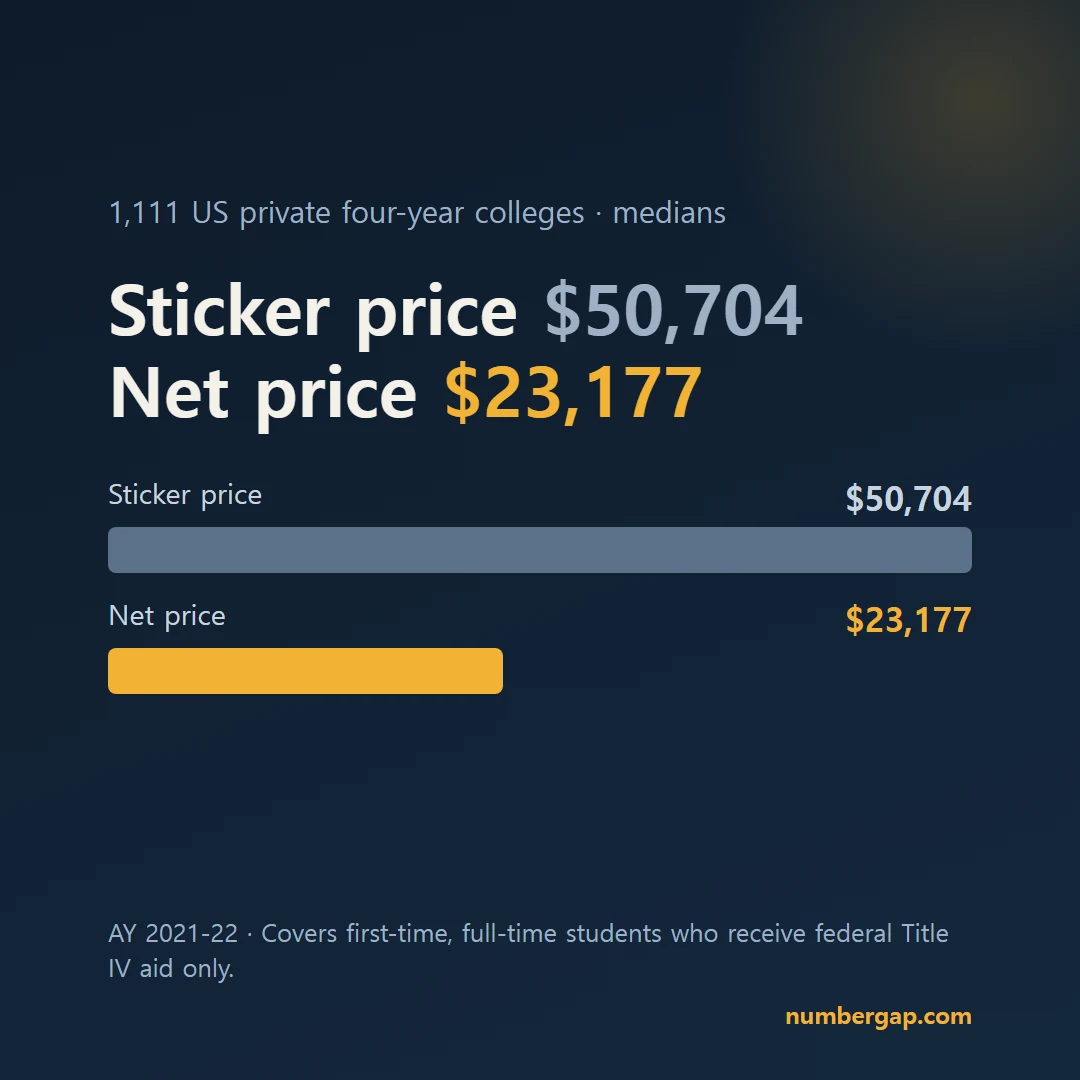
The U.S. Department of Education's College Scorecard lists, for each four-year college, an average cost of attendance and an average net price. I filtered the file down to 1,760 four-year colleges and took the medians. At the 1,111 private colleges that report both numbers, the median sticker price is $50,704. The median net price is $23,177.
That is a little over half off. It is the number behind every "nobody pays sticker price" headline.
But the data dictionary has a sentence about whose number it is. Follow that sentence and you end up in federal student aid law, at a clause that decides which students can ever appear in this statistic.
As of November 5, 2026. Every net price in this post is for academic year 2021-22. That is the newest net price the federal government publishes.
How Much Does College Cost After Financial Aid?
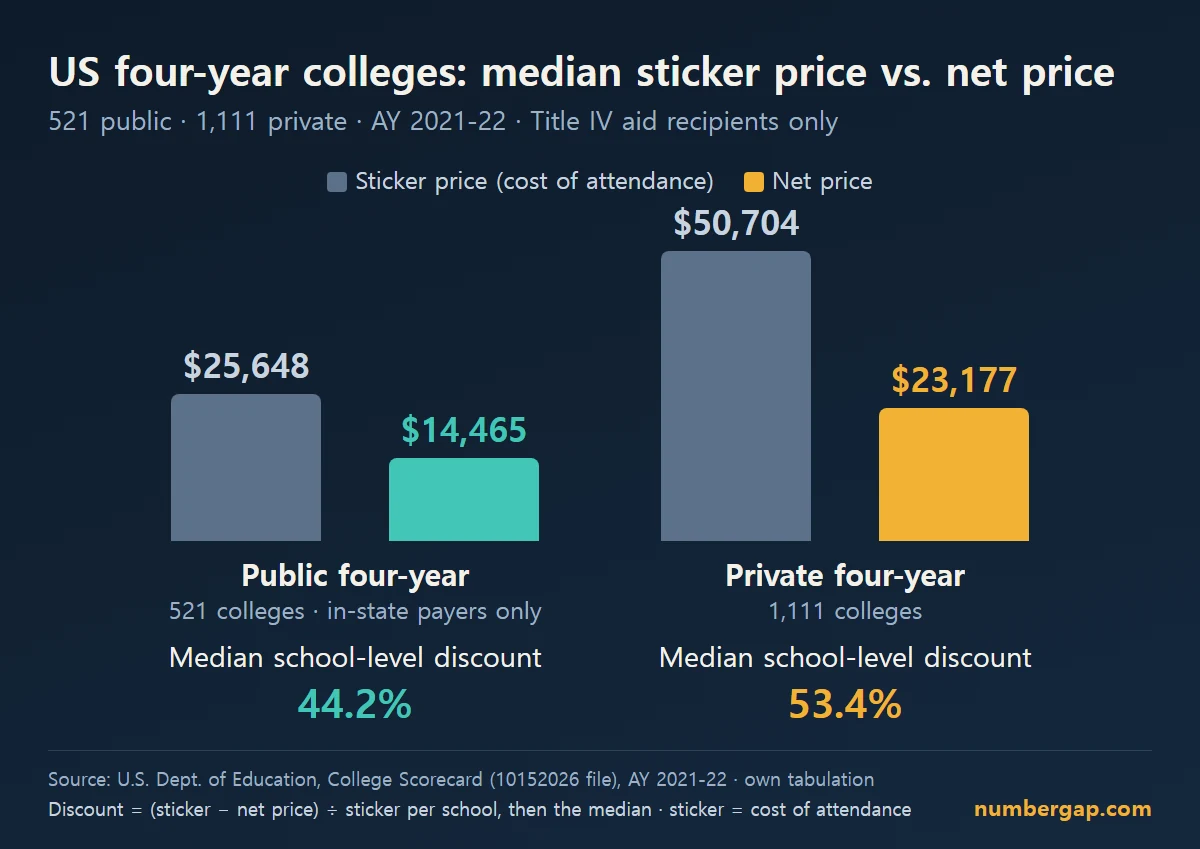
At private four-year colleges, the median sticker price is $50,704 and the median net price is $23,177. At public four-years, it is $25,648 and $14,465. Computed school by school, the median discount is 53.4% at privates and 44.2% at publics.
| Median sticker price | Median net price | Median school-level gap | Median school-level discount | |
|---|---|---|---|---|
| Public four-year (521 schools) | $25,648 | $14,465 | $11,147 | 44.2% |
| Private four-year (1,111 schools) | $50,704 | $23,177 | $26,852 | 53.4% |
(School-level medians. Net price is AY 2021-22 for first-time, full-time students receiving Title IV aid; at publics, only in-state payers. The discount is (sticker minus net price) divided by sticker price, worked out for each school, then the median taken. My own tabulation, not an official statistic.)
"Sticker price" here is the Scorecard's average cost of attendance. It includes tuition and fees, books and supplies, and living expenses. Net price subtracts the average grant and scholarship aid.
I computed the gap and the discount school by school first, then took the median. That is why they will not equal what you get by subtracting one median from the other.
Source: U.S. Department of Education, College Scorecard, Most-Recent-Cohorts-Institution file (10152026 release) and data dictionary; my tabulation. Government data, aggregated by me.
https://collegescorecard.ed.gov/data/
A word on dates. The columns in this one file run on different clocks: net price and cost of attendance are 2021-22, tuition is 2022-23, international enrollment is fall 2022. I did not build any ratio across years.
The College Board's numbers look different, because they measure something else. For 2025-26, it puts published tuition and fees at $45,000 for private nonprofit four-years and estimates net tuition and fees at about $16,910. For public in-state, $11,950 falls to about $2,300. Add housing, food and allowances, and its estimated net cost of attendance is about $37,380 at privates and $21,340 at publics.
Source: College Board, Trends in College Pricing and Student Aid 2025 (Nov. 2025). Some years are projections. Averages across students, including those who received no grant aid.
https://research.collegeboard.org/media/pdf/Trends-in-College-Pricing-and-Student-Aid-2025-final_0.pdf
How Much Does the Discount Vary From College to College?
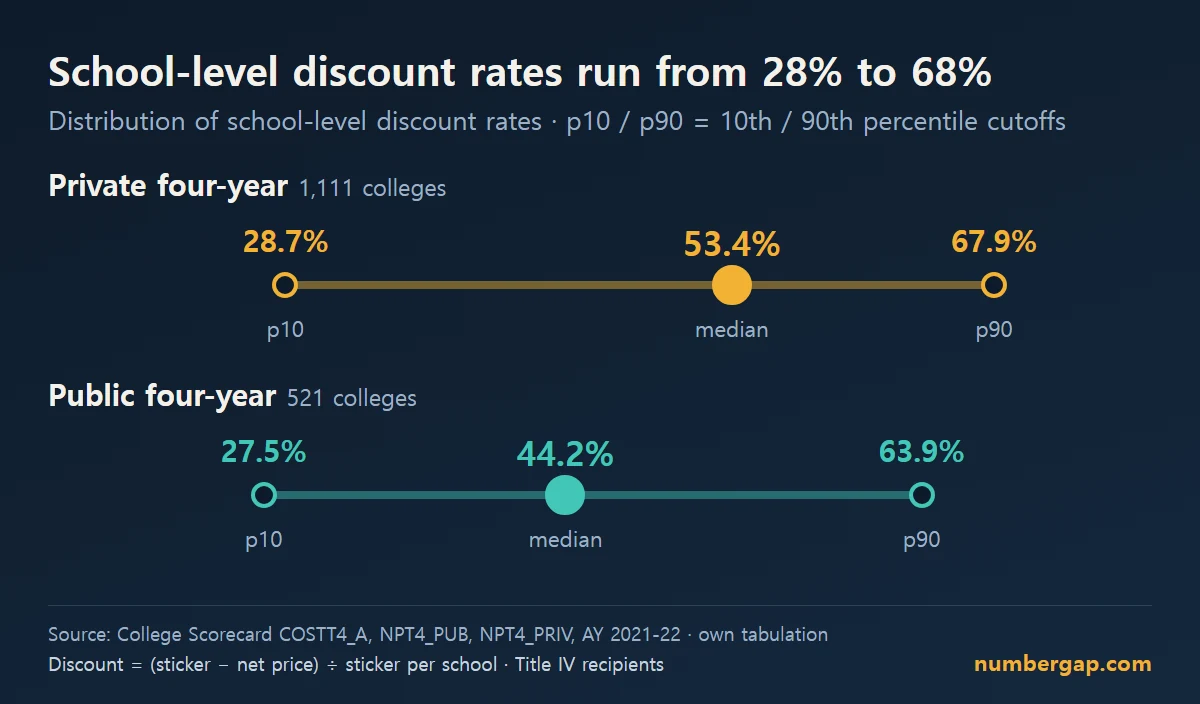
Enormously. "About half off" is the middle of the pack. Among private colleges, school-level discounts run from 28.7% to 67.9% between the 10th and 90th percentile.
| 10th percentile | Median | 90th percentile | |
|---|---|---|---|
| Private four-year (1,111 schools) | 28.7% | 53.4% | 67.9% |
| Public four-year (521 schools) | 27.5% | 44.2% | 63.9% |
(Each school's discount is (sticker minus net price) divided by sticker price. AY 2021-22, Title IV recipients. My tabulation.)
One private college in ten discounts its sticker price by 28.7% or less. Another one in ten discounts it by 67.9% or more.
Here is what that width looks like in dollars.
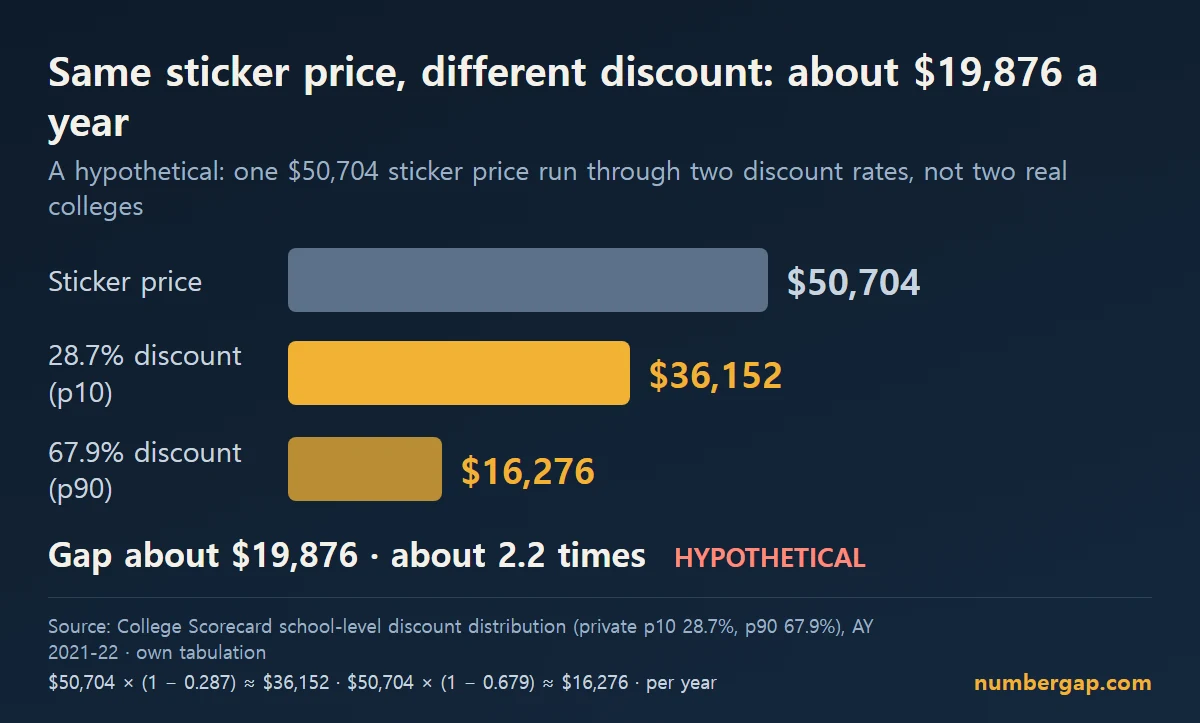
Suppose two private colleges both have the median sticker price of $50,704. One discounts it by 28.7%, the other by 67.9%.
| Discount | What you pay on a $50,704 sticker price |
|---|---|
| 28.7% | about $36,152 |
| 67.9% | about $16,276 |
(My arithmetic. This is a hypothetical, applying two discount rates to the same sticker price, not two real colleges. Annual figures.)
The difference is about $19,876 a year, a factor of 2.2. A family that memorized "about half off" could land on either side of that gap.
Publics are just as wide, 27.5% to 63.9%. Apply the same two rates to the public median sticker price of $25,648 and you get about $18,595 versus about $9,259, a gap of about $9,336 and a factor of 2.0. Again, my arithmetic and a hypothetical.
A caution on reading the percentiles: the 10th and 90th percentile mark the edges of the middle 80% of schools. They are not the lowest and highest. There are more extreme schools beyond them.
And this tabulation cannot tell you which side any given school is on.
The average will not answer that. Only the school's own net price will, which is what the net price calculator at the end of this post is for.
Source: College Scorecard fields COSTT4_A, NPT4_PUB and NPT4_PRIV, my tabulation. Government data, aggregated by me.
How Much Does Net Price Change With Family Income?
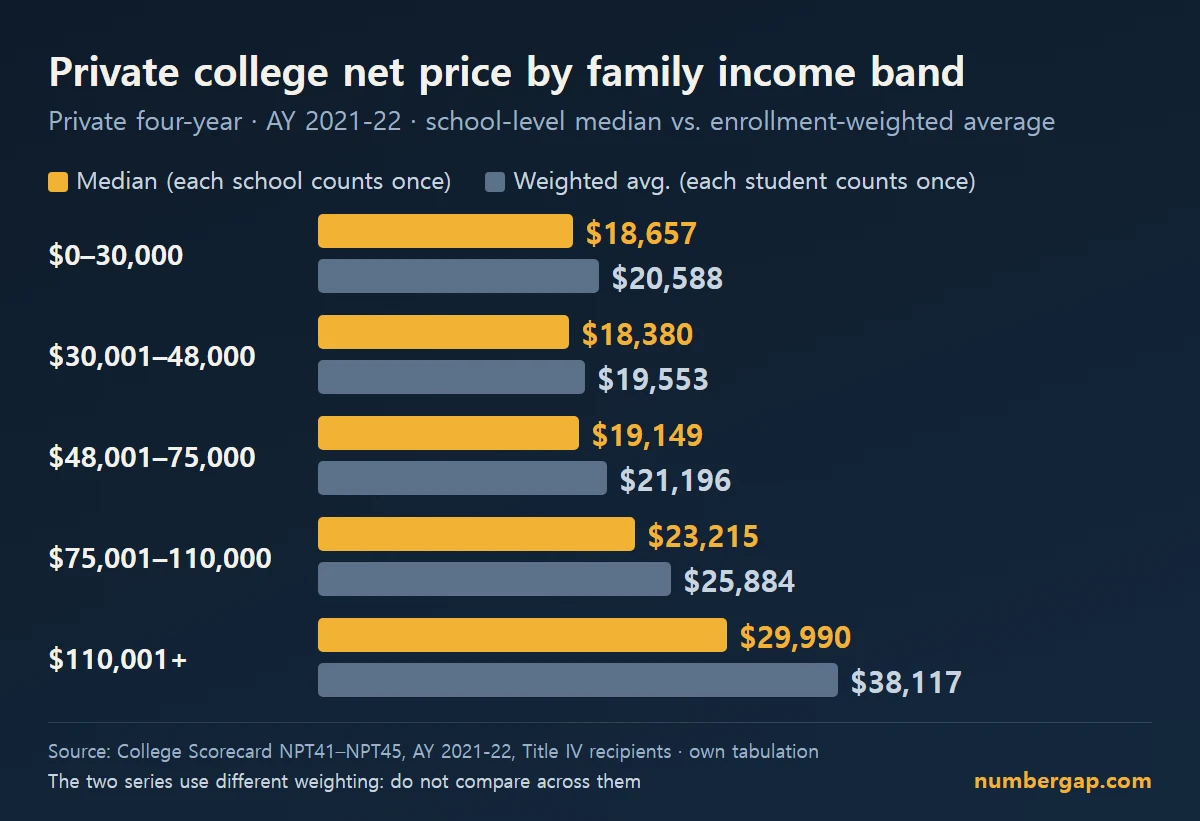
At private colleges, median net price runs from $18,657 for families earning $0-30,000 to $29,990 for families above $110,000. The lowest-income band still pays a median of $18,657.
| Family income | Median net price (school level) | Enrollment-weighted average | Students |
|---|---|---|---|
| $0-30,000 | $18,657 | $20,588 | 97,336 |
| $30,001-48,000 | $18,380 | $19,553 | 37,779 |
| $48,001-75,000 | $19,149 | $21,196 | 44,600 |
| $75,001-110,000 | $23,215 | $25,884 | 42,059 |
| $110,001+ | $29,990 | $38,117 | 106,176 |
(Private four-year, AY 2021-22, Title IV recipients. The median counts each school once; the weighted average counts each student once. Don't compare across the two columns.)
The curve is not a clean staircase. The $30,001-48,000 band is slightly cheaper than the lowest band.
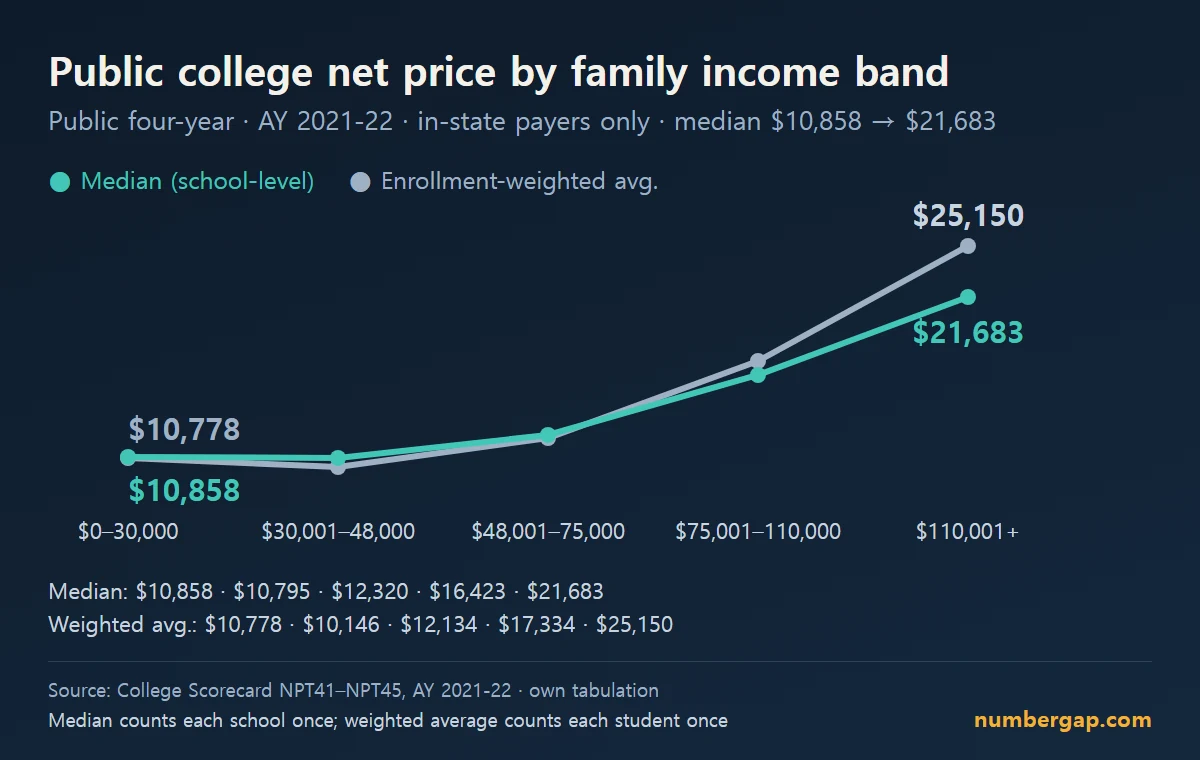
At public four-years, the school-level median goes from $10,858 to $21,683 across the same bands. The enrollment-weighted average goes from $10,778 to $25,150.
Source: College Scorecard fields NPT41 through NPT45, my tabulation. Government data, aggregated by me.
Is the Private College Discount 53.4%, 57.1% or 62%?
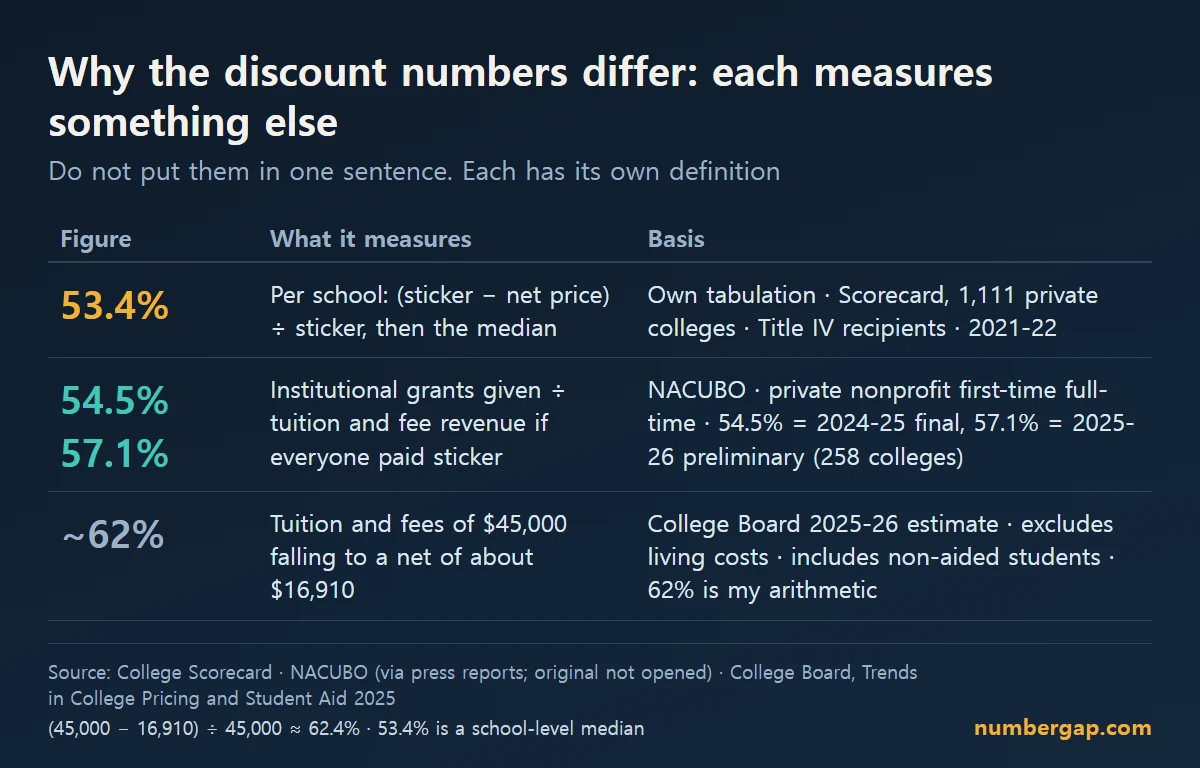
All three are real. They measure different things, and being close in size does not make them the same. They should never share a sentence without definitions.
| Figure | What it measures | Basis |
|---|---|---|
| 53.4% | Each school's (sticker minus net price) divided by sticker price, then the median | My tabulation, 1,111 private colleges in Scorecard, Title IV recipients, AY 2021-22 |
| 54.5% / 57.1% | Institutional grant aid divided by the tuition revenue the school would collect if everyone paid full price | NACUBO survey of private nonprofits, first-time full-time students. 54.5% is final for 2024-25; 57.1% is a preliminary 2025-26 estimate from 258 institutions |
| About 62% | $45,000 published tuition and fees falling to about $16,910 net | College Board, 2025-26 estimate, tuition and fees only, averaged across all students including those with no aid. The 62% is my arithmetic |
Source: NACUBO figures as reported by Higher Ed Dive (June 1, 2026) and Inside Higher Ed (June 1, 2026). Secondary reporting; I did not open the NACUBO report.
NACUBO also reports that 90% of first-time, full-time students got some institutional aid.
It is tempting to flip that and say 10% pay full price. You can't. A student with no institutional aid may still have outside scholarships or state aid. I did not find a "full-pay" share in any of the coverage.
Who Is Actually Counted in the "Net Price" Number?
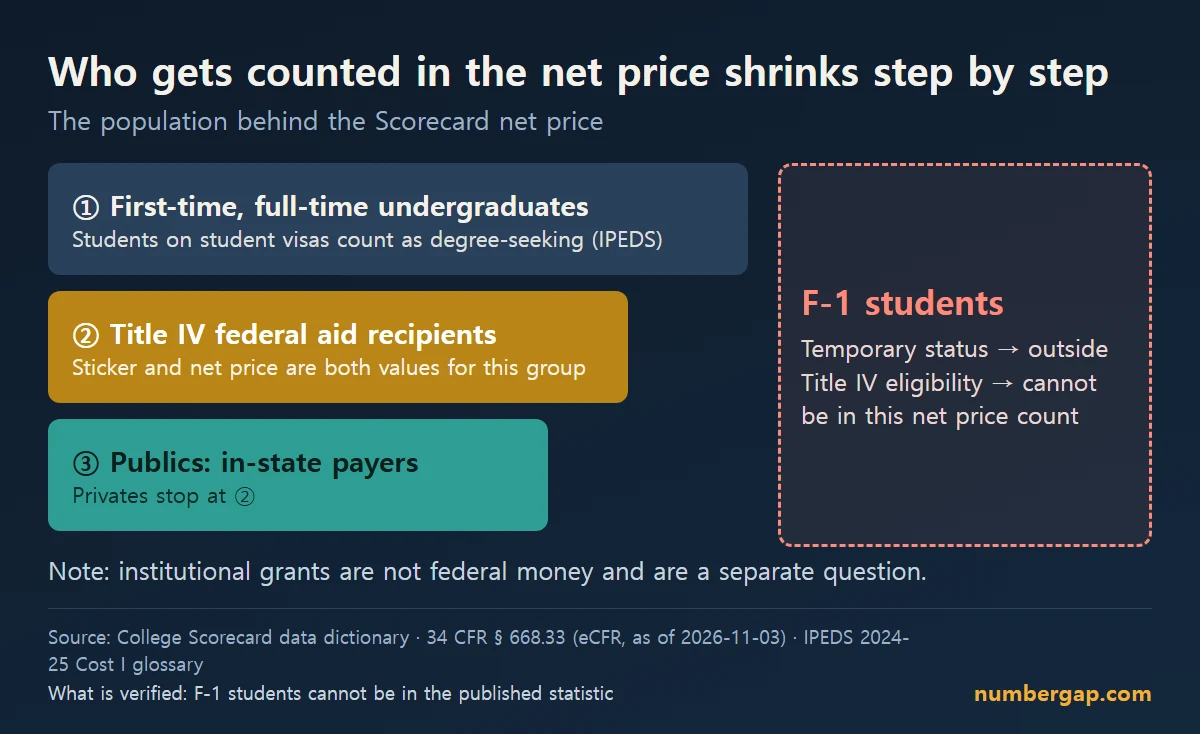
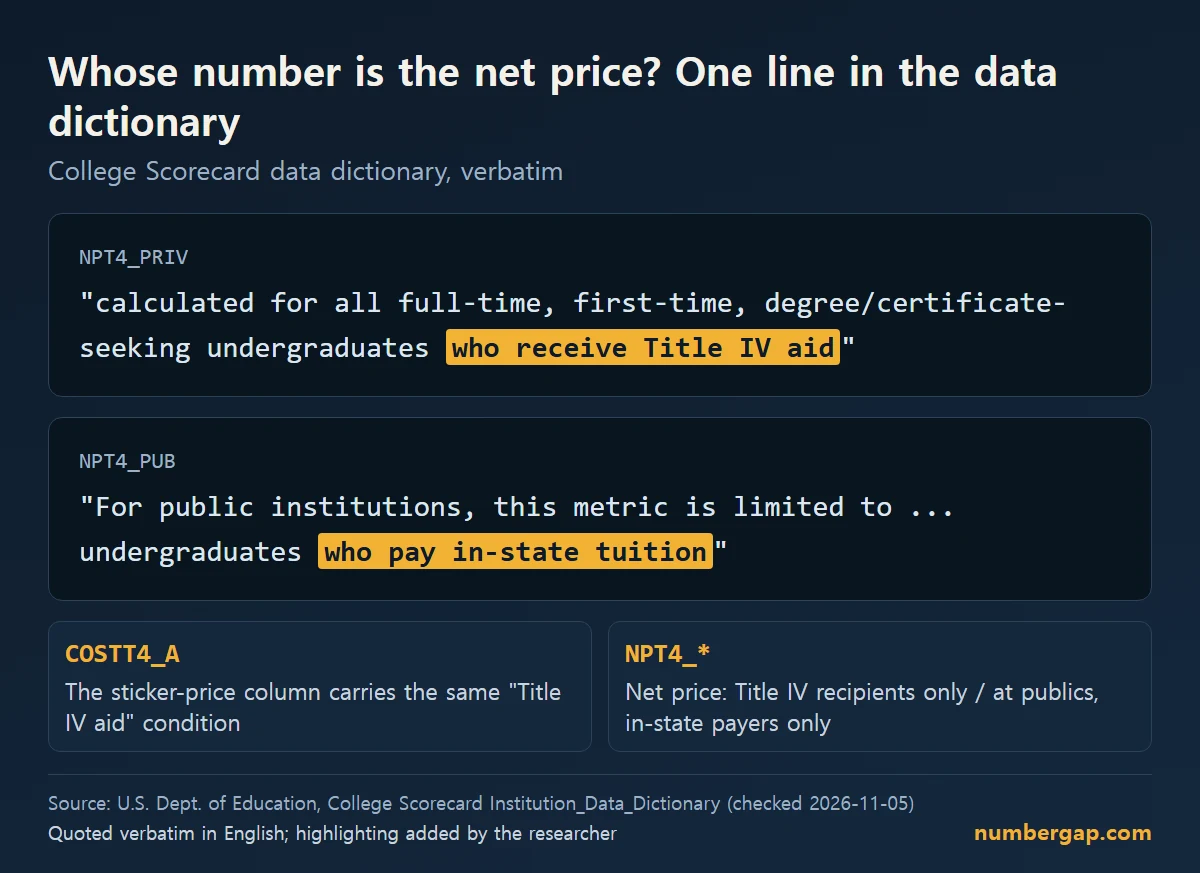
Only students who receive Title IV federal aid. The Scorecard's data dictionary says so for both the sticker price and the net price.
Here is the entry for private-college net price (NPT4_PRIV):
"calculated for all full-time, first-time, degree/certificate-seeking undergraduates who receive Title IV aid"
The public-college field adds a second filter:
"For public institutions, this metric is limited to ... undergraduates who pay in-state tuition"
Then I checked the cost of attendance column (COSTT4_A), the one I'd been calling the sticker price. Same phrase. "Who receive Title IV aid."
Source: College Scorecard data dictionary, Institution_Data_Dictionary sheet. Government data; quoted from the original.
https://collegescorecard.ed.gov/assets/CollegeScorecardDataDictionary.xlsx
So the $50,704 and the $23,177 describe one group: first-time, full-time students getting federal aid. Transfers and continuing students are not in it.
The statute defines net price the same way: the average yearly price actually charged to first-time, full-time undergraduates receiving student aid, after subtracting that aid.
Source: 20 U.S.C. § 1015a(a)(3). Federal statute.
https://www.law.cornell.edu/uscode/text/20/1015a
NCES computes net price for two cohorts in IPEDS. One is students awarded grants from federal, state or institutional sources. The other is students awarded Title IV aid. The Scorecard publishes the second.
Source: NCES IPEDS Average Net Price FAQ; IPEDS 2024-25 Cost I survey package. Government documents.
Can an F-1 Student Ever Be Counted in That Number?
No. The Title IV eligibility rule does not name F-1 students. It screens on a condition that F-1 status cannot meet.
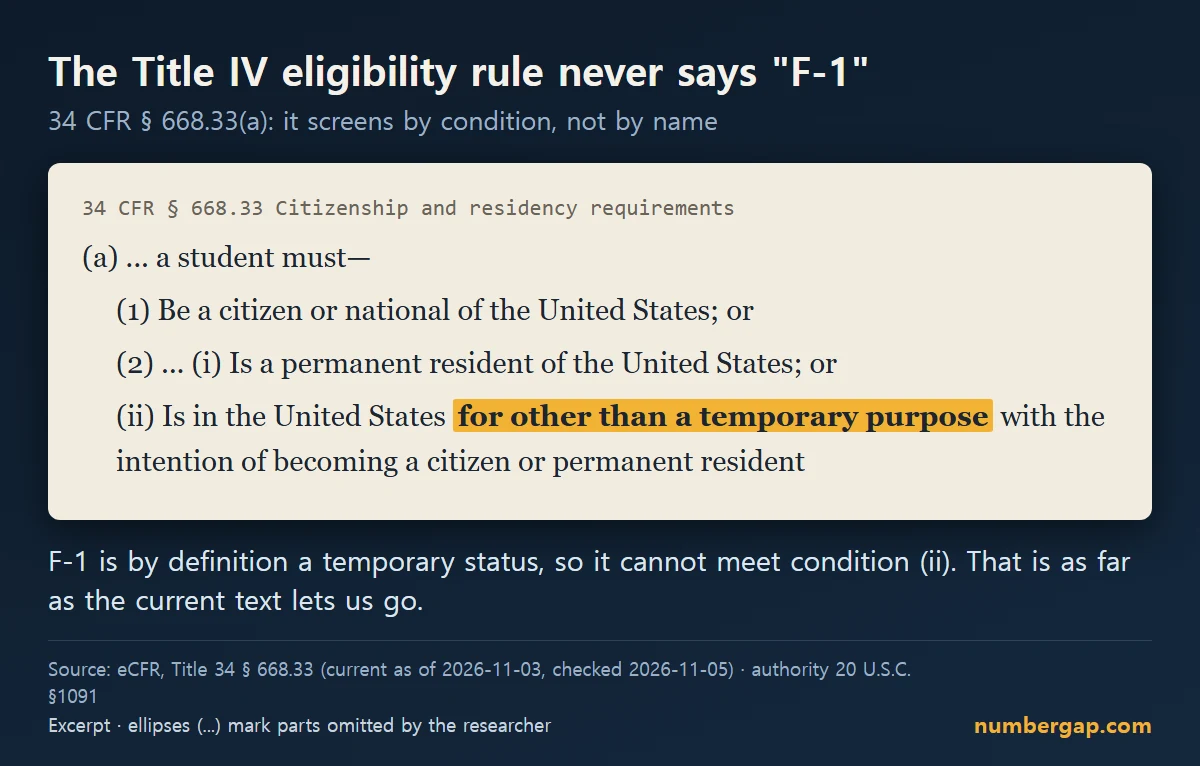
I opened the current text of 34 CFR § 668.33 in the eCFR. The eCFR title was current through November 3, 2026, and I checked it on November 5. To get Title IV aid, a student must either be:
(1) a citizen or national of the United States; or
(2) ... (i) a permanent resident of the United States; or
(ii) in the United States for other than a temporary purpose with the intention of becoming a citizen or permanent resident
The words "F-1" do not appear.
But F-1 is, by definition, a temporary status. It cannot satisfy clause (ii), so an F-1 student cannot be a Title IV recipient, so an F-1 student cannot be in the Scorecard's net price population.
Source: 34 CFR § 668.33 (eCFR, current through 2026-11-03); authorizing statute 20 U.S.C. § 1091. Federal regulation text.
https://www.ecfr.gov/current/title-34/subtitle-B/chapter-VI/part-668/subpart-C/section-668.33
The Department of Education has also said it by name. Its Federal Student Aid guidance listed holders of F-1 or F-2 student visas, J-1 or J-2 exchange visitor visas, and G-series visas as not eligible noncitizens who cannot receive federal student aid.
I tried to read the current version.
The studentaid.gov page returned HTTP 403. So did the FSA Handbook. What I read is a snapshot archived on January 7, 2017. So here is exactly what I can claim: the current regulation screens by the "temporary purpose" condition, and the notice naming F-1 I confirmed only in a 2017 archived copy. I could not confirm today's wording.
Source: U.S. Department of Education, Federal Student Aid, "Non-U.S. Citizens," archived January 7, 2017 (UNT Web Archive). A nine-year-old copy.
One more detail. IPEDS's own glossary counts students who obtained a student visa as degree-seeking students. An F-1 freshman is in the college's enrollment headcount and absent from the Scorecard net price.
Source: IPEDS 2024-25 Cost I survey glossary, "Degree/certificate-seeking students."
That is what is established:
The population behind the published net price statistics cannot structurally include F-1 students.
It does not say that international students get no discount. Institutional aid is not federal money. Some colleges give it. The next section is what I could find.
Do International Students Get Any Discount at All?
Sometimes, and it depends on the school. I found no national figure.
What the national numbers say
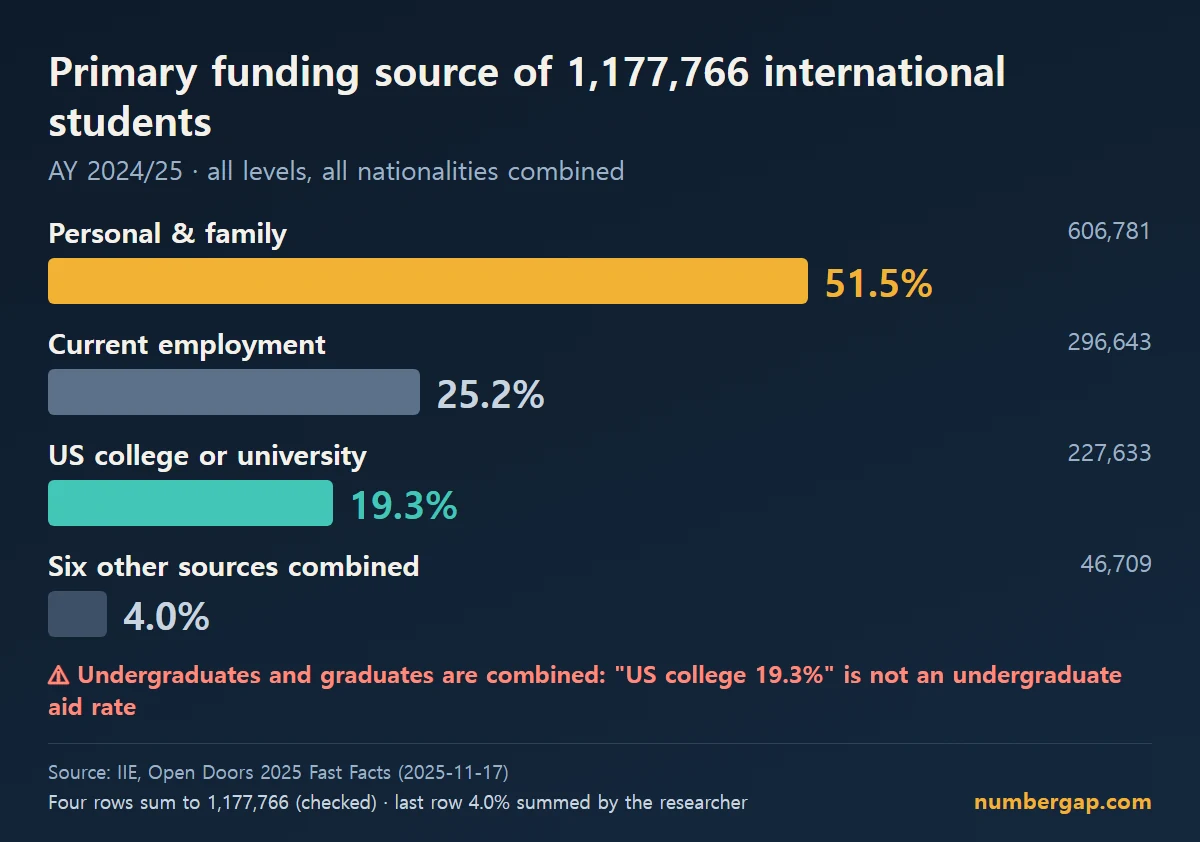
IIE's Open Doors 2024/25 reports the primary source of funding for 1,177,766 international students.
| Primary source | Students | Share |
|---|---|---|
| Personal and family | 606,781 | 51.5% |
| Current employment | 296,643 | 25.2% |
| U.S. college or university | 227,633 | 19.3% |
| Six other categories combined | 46,709 | 4.0% |
(AY 2024/25, all levels and nationalities. I checked that the rows sum to the total. The last row is my sum.)
Do not read the 19.3% as an undergraduate scholarship rate. This table blends undergraduates (357,231 that year) with graduate students (488,481). Graduate assistantships and fellowships sit in the same bucket, and the public table does not split them. The by-level funding table is behind a member login. I also found no sentence connecting "current employment" to any specific visa category, so I do not interpret it.
Source: IIE, Open Doors 2025 Fast Facts, Nov. 17, 2025. Survey-based tabulation.
https://opendoorsdata.org/wp-content/uploads/2025/11/OD25_Fast-Facts.pdf
What three schools say, in their own words
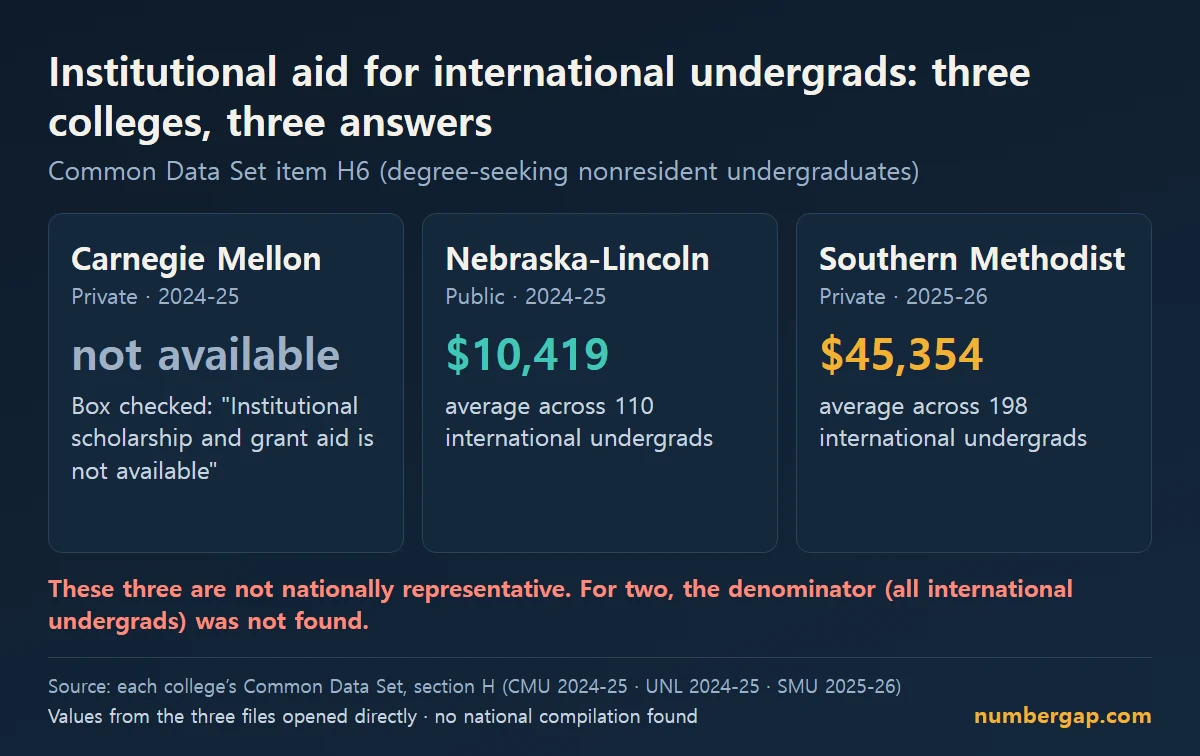
Item H6 of the Common Data Set asks a college about institutional aid for degree-seeking nonresident (international) undergraduates: whether it is available, how many students got it, and the average. I read three.
| College | H6 answer |
|---|---|
| Carnegie Mellon (private), 2024-25 | Box checked: "Institutional scholarship and grant aid is not available" |
| Univ. of Nebraska-Lincoln (public), 2024-25 | 110 international undergraduates received an average of $10,419 |
| Southern Methodist (private), 2025-26 | 198 international undergraduates received an average of $45,354 |
One school says no. One gives modest awards. One gives large ones. Same question, three answers.
Three schools prove nothing about the country. For UNL and SMU I could not retrieve the number of international undergraduates, so I do not know what share got aid. I found no national compilation of H6.
Source: Each college's Common Data Set. Institution-submitted data.
https://www.cmu.edu/ira/CDS/pdf/cds_2024-25/cds-2024-h-student-financial-aid-21feb2025.pdf
https://iea.unl.edu/common-data-set-2024-2025/h-financial-aid/aid-undergraduate-degree-seeking-nonresidents
https://www.smu.edu/-/media/site/ir/commondatasets/2025/cds-2025-26-part-h-financial-aid.pdf
NAFSA describes institutional aid for undergraduate international students as uncommon and competitive, and says most institutional aid for international students goes to graduate study. I saw this only in a search-result summary, and the page is undated.
Proof of funds comes before enrollment. DHS's Study in the States says F-1 applicants must show enough funds for tuition and living costs before the designated school official issues the I-20. That page also returned 403; this is from a search summary.
So the fair summary is this. What an international student pays depends on the school's policy, and no national average is published.
What Do Out-of-State and International Students Pay at Public Universities?
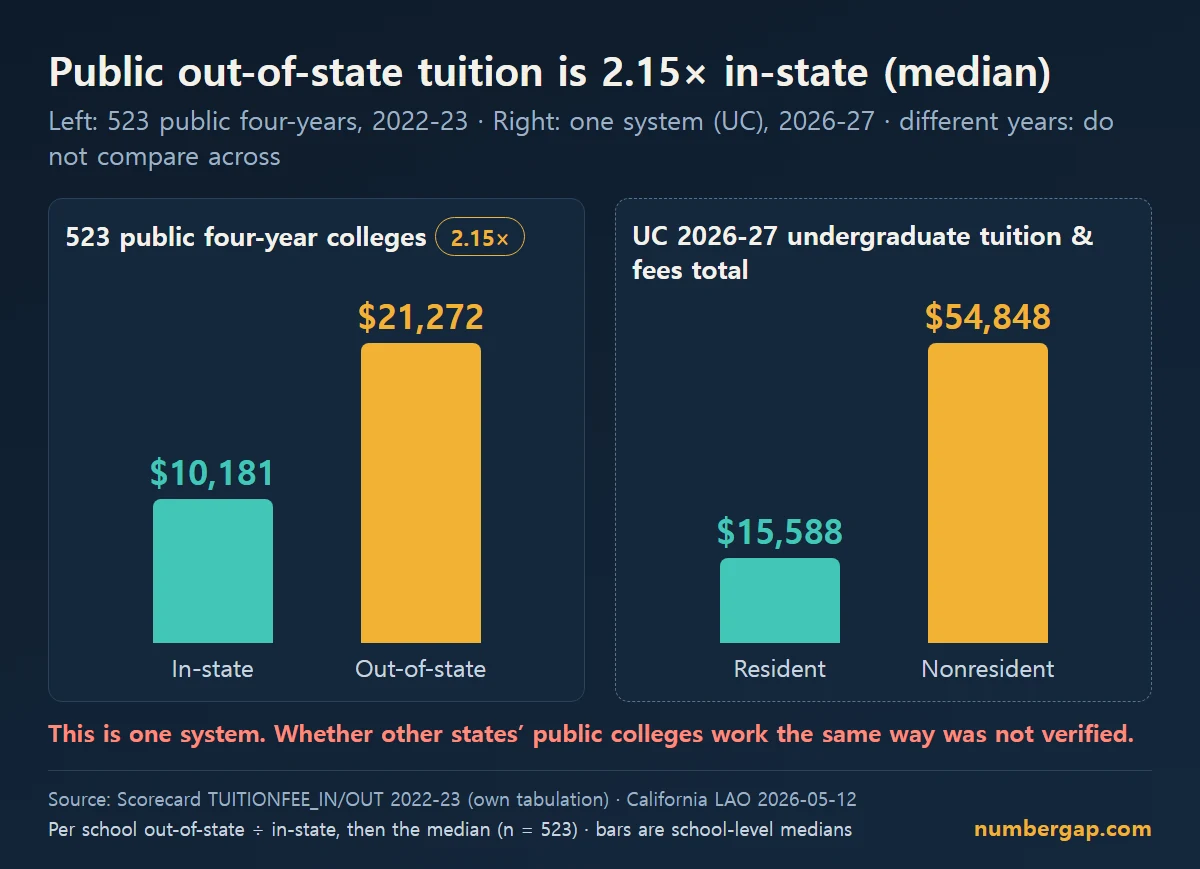
In my tabulation, out-of-state tuition at public four-years is 2.15 times in-state: a median of $21,272 against $10,181, across 523 schools.
(Tuition for 2022-23, school-level medians. The net prices above are 2021-22, so these are different years.)
That is how far apart the two rates sit at the median public college. The in-state rate is the one that applies to residents of that state.
This is where the post circles back to its starting point.
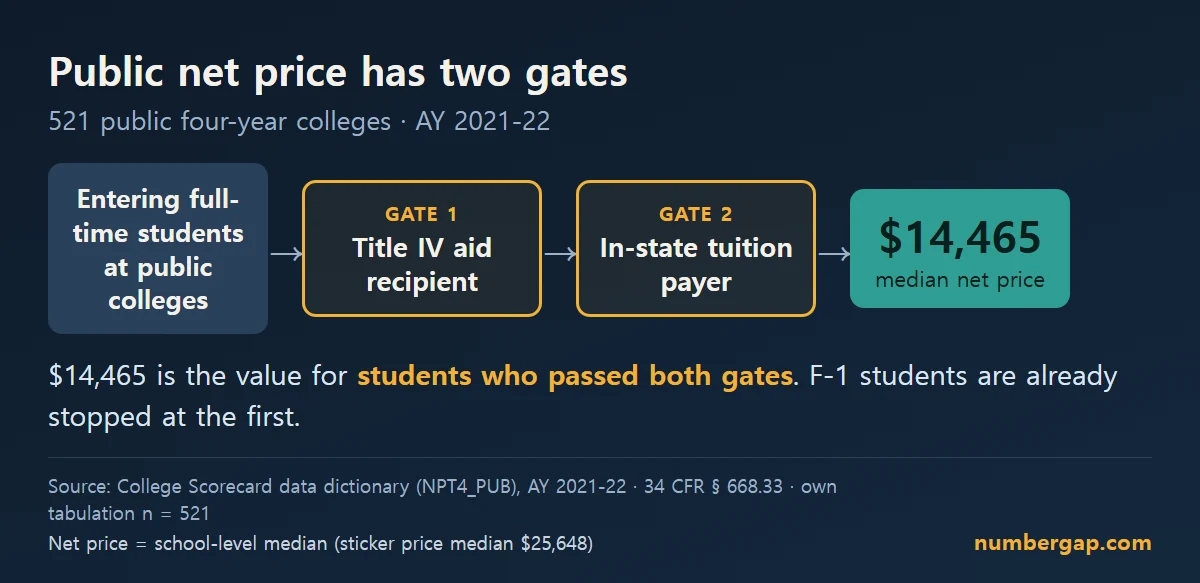
The public-college net price has two gates. The first is that the student must receive Title IV aid. The second is that the student must pay in-state tuition. The $14,465 median net price at publics describes students who cleared both.
An F-1 student fails the first gate. What about the second? The California Legislative Analyst's Office (May 12, 2026) says undergraduates from other states and other countries pay nonresident supplemental tuition at the University of California. For 2026-27, UC undergraduate tuition and fees total $15,588 for residents and $54,848 for nonresidents.
In that one system, international students stand on the nonresident side of the line. The published public net price counts in-state payers only. So what an international student pays at a public college is outside that statistic twice over, at least at UC.
That is one system. I did not check other states. The University of Nebraska-Lincoln's tuition page did not list its rates in the text I could read, so I could not check it either.
For comparison, College Board's enrollment-weighted figures for 2026-27 are $12,290 in-state and $32,730 out-of-state, about 2.7 times by my arithmetic. The gap from 2.15 is consistent with school medians versus enrollment-weighted averages and different years. The College Board page shows no publication date.
Source: California Legislative Analyst's Office, May 12, 2026. State legislative agency report.
https://lao.ca.gov/Publications/Report/5183
Source: College Board, Trends in College Pricing highlights (labeled 2026-27, undated).
https://research.collegeboard.org/trends/college-pricing/highlights
What Could I Not Verify?
Here are the gaps, each with the reason I could not close it.
- The current studentaid.gov and FSA Handbook text on international students. Both returned HTTP 403 to me. I tried again later in a browser and was blocked again.
- A current notice naming F-1 as ineligible. Because of item 1, I confirmed it only in a January 7, 2017 archived copy. I cannot say today's wording is the same.
- A national statistic on international undergraduates' institutional aid. I found none. No one appears to have compiled Common Data Set item H6 nationally. I read three schools, and for two of them I could not get the denominator, the number of international undergraduates.
- The by-level Open Doors funding table. It is in a workbook behind a member login, so I could not split the 19.3% into undergraduate and graduate.
- Whether the first IPEDS cohort (students with any grant aid) includes international students. I searched the instruction packages for "nonresident," "international" and "alien" and found none of them. With no sentence either way, I do not state it. Only the second cohort, the one the Scorecard publishes, is confirmed to exclude F-1.
- How net price calculators handle international students. The statute text I read (20 U.S.C. § 1015a(h)) has no international provision, and I found no national count of calculators that offer one.
- The NACUBO report itself. I did not open it. The definition comes from quotes in news coverage, so 54.5% and 57.1% are secondary-source figures.
- The share of students who pay full sticker price. It does not appear anywhere I looked. NACUBO coverage does not report it, and the complement of the 90% who got institutional aid is not a full-pay rate, so I did not compute it.
- Other things I left out. A list of schools that are need-blind for international applicants appeared only in secondary sources and a commercial site that disagree with each other, so I named no schools. A 2022-23 U.S. News ranking of international aid, republished by WTOP, had a dead source page (404), so I did not use it.
My filter: operating main campuses, bachelor's-degree-focused, four-year, which gives 1,760 colleges (545 public, 1,149 private nonprofit, 66 private for-profit). The 1,632 with both sticker and net price feed the medians. I did not treat suppressed values as zero.
FAQ
Q. How much does college cost per year in the US?
A. The newest federal figures (AY 2021-22, federal aid recipients) put the median net price at $23,177 for private four-years and $14,465 for public four-years. Median sticker prices are $50,704 and $25,648, and include living expenses. Those are not international students' prices.
Q. What is the difference between net price and sticker price?
A. Sticker price is the published cost. Net price is that cost minus the average grant and scholarship aid. In the federal statistics, it is calculated for first-time, full-time undergraduates receiving aid.
Q. How much of the sticker price do colleges actually discount?
A. Worked out school by school, the median discount is 53.4% at private four-years and 44.2% at publics (AY 2021-22, Title IV recipients). It varies widely: private schools run from 28.7% at the 10th percentile to 67.9% at the 90th. NACUBO's 54.5% and 57.1% use a different definition.
Q. Do most students pay the full sticker price?
A. I found no "full-pay" share. NACUBO reports that 90% of first-time, full-time students at responding private nonprofits received institutional aid in 2025-26 (preliminary), but the remaining 10% did not necessarily pay full price.
Q. Can F-1 international students get federal financial aid?
A. No. Title IV requires citizenship, national status, permanent residence, or presence for other than a temporary purpose, and F-1 is a temporary status. This applies to federal money only; college scholarships are separate.
Q. Do US colleges give scholarships to international students?
A. It depends on the school. Of three I checked, Carnegie Mellon said institutional aid is not available, while Nebraska-Lincoln and SMU gave international undergraduates an average of $10,419 and $45,354. There is no national rate.
Q. What percentage of international students are funded by US colleges?
A. Open Doors 2024/25 lists 19.3% as primarily funded by a US college or university, but that figure blends undergraduate and graduate students, so it is not an undergraduate scholarship rate.
Q. How much more is out-of-state tuition than in-state at public universities?
A. In my tabulation of 523 public four-years, the median is 2.15 times (2022-23). College Board's enrollment-weighted 2026-27 figures imply about 2.7 times. International students pay the nonresident rate at the University of California; I did not check other systems.
Q. Does the net price calculator work for international students?
A. I could not confirm it. The law requires every college that receives Title IV funds to post one, but the text I read does not say how international students are handled, and the required notice refers to the FAFSA.
Run the Net Price Calculator, Then Ask the Question It Doesn't Answer
Because discounts run from under 30% to nearly 70% depending on the college, no average tells you where a given school falls. Every college that receives Title IV funds must post a net price calculator. It must produce an estimate for an individual student and carry a notice that the result is not a final determination and that the student must file the FAFSA to receive an actual award.
Source: 20 U.S.C. § 1015a(h). Federal statute.
https://www.law.cornell.edu/uscode/text/20/1015a
The FAFSA is the application for federal aid. For an F-1 student, that notice does not describe the path to anything. The statute does not say what the calculator should do for an international applicant.
So if you are an international family, use the calculator, then email the admissions office one question: does the college give its own aid to international undergraduates, and how many students and how many dollars last year?
Many colleges post their Common Data Set online. All three I read did. Item H6 is the answer to that question, in the college's own numbers.
"Students actually pay about half" is true for some students. For others, nobody has counted yet.
Thanks for reading. Check the numbers against the sources linked above.
This post summarizes public statistics and rules I checked. It is not financial, legal or immigration advice; confirm individual decisions with the college and official agencies.


Comments
Post a Comment