How Much Do You Need to Retire? The $1.46M 'Magic Number'
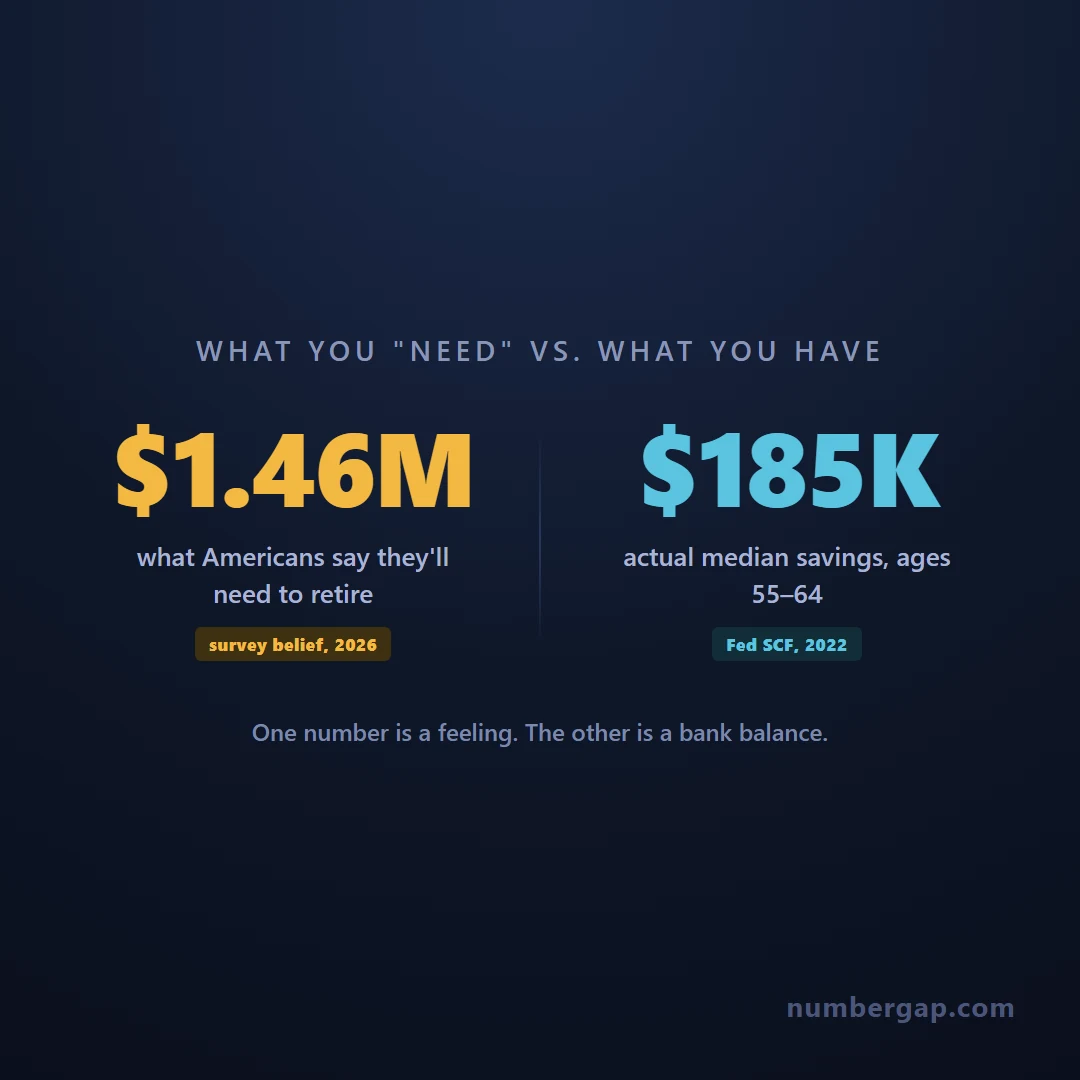
Every April, one insurance company tells Americans
how much they need to retire.
The number has swung by six figures
almost every single year since 2020.
Last updated: 7 September 2026 · Figures and rules in this post are current as of this date.
That company is Northwestern Mutual, and the figure is what's become known as the retirement "magic number" — currently $1.46 million. It's the number behind most of the headlines you've seen about how much you need to retire comfortably. But when CBS News asked Northwestern Mutual's own chief strategy officer, Aditi Javeri Gokhale, how the number is actually produced, she didn't describe a formula. She described a feeling.
What Is the Retirement "Magic Number," Really?
The magic number comes from Northwestern Mutual's annual Planning & Progress Study, conducted by The Harris Poll. It is not a target the company calculated for you — it's the average dollar figure people give when asked how much they think they'll need to live comfortably in retirement.
"There is no major calculation; it's a feeling. Some of them probably have done some math... but it generally comes [down] to feeling."
— Aditi Javeri Gokhale, Northwestern Mutual chief strategy officer, to CBS News
Source: CBS News, "Here's how much Americans say they need to retire — and it's 53% higher than four years ago," cbsnews.com, 2026
Northwestern Mutual's own executives are careful about what the number is not. John Roberts, the company's EVP and chief field officer, has called it a "guidepost" for retirement planning — not a specific savings goal.
Source: Reported across multiple outlets covering the 2026 study release, including Yahoo Finance/AOL syndication, April 2026
Even Northwestern Mutual's own educational site lists the magic number as just one of several rules of thumb — alongside the 25x Rule and the 4% Rule — and states: "The amount you actually need to save is unique to you... Your need will be based on what your retirement might cost."
Source: northwesternmutual.com/life-and-money/retirement-savings-rules-of-thumb/, accessed 2026
2026 survey methodology, confirmed from the primary source: The Harris Poll surveyed 4,375 U.S. adults 18 and older online between January 5–21, 2026, with data weighted by age, gender, race/ethnicity, region, education, marital status, household size, income, and likelihood of being online.
Source: Northwestern Mutual 2026 Planning & Progress Study press release, news.northwesternmutual.com, April 1, 2026
Why Did the Number Jump $200K, Drop $200K, Then Jump Again?
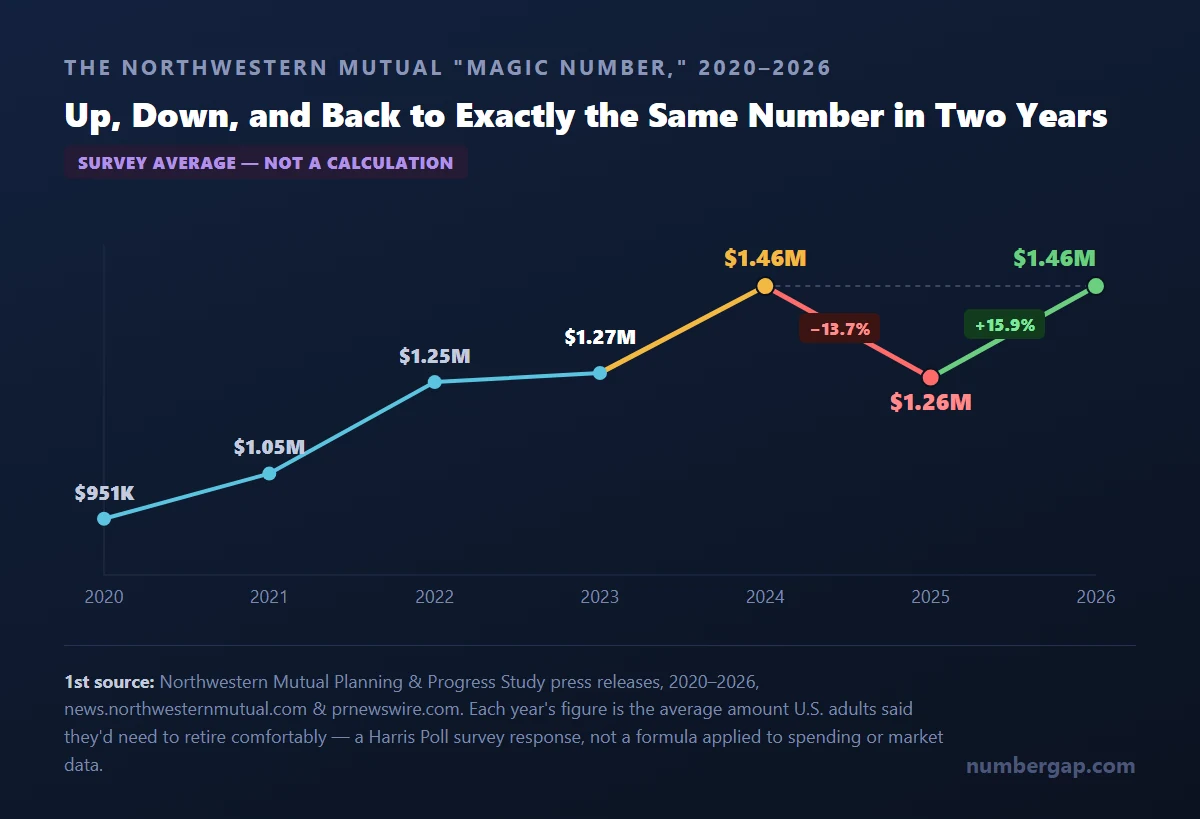
Because it's tracking a belief, not a calculation — and beliefs move with the news cycle, not with actuarial tables. Here's the full five-year run, cross-checked against each year's original press release rather than secondary write-ups.
| Year | "Magic Number" | Change from prior year |
|---|---|---|
| 2020 | $951,000 | — (baseline) |
| 2021 | $1.05 million | +$99,000 (+10.4%) |
| 2022 | $1.25 million | +$200,000 (+19.0%) |
| 2023 | $1.27 million | +$20,000 (+1.6%) |
| 2024 | $1.46 million | +$190,000 (+15.0%) |
| 2025 | $1.26 million | −$200,000 (−13.7%) |
| 2026 | $1.46 million | +$200,000 (+15.9%) |
Source: Northwestern Mutual Planning & Progress Study press releases, 2024–2026, news.northwesternmutual.com and prnewswire.com
Look closely at the last three years: up $190,000, down $200,000, up $200,000 — landing back at exactly $1.46 million, the same nominal number as two years before. Over the full six-year span, the figure rose from $951,000 to $1.46 million, a 53.5% increase, which significantly outpaced actual cumulative inflation over the same period.
Northwestern Mutual's own explanation for the 2025 dip, from John Roberts: inflation, while still Americans' top financial worry, "isn't as elevated as it was in recent years" — it cooled from about 6% in 2023 to roughly 3% in 2024.
Source: Northwestern Mutual 2025 Planning & Progress Study press release, news.northwesternmutual.com, April 14, 2025
Real market prices, real health care costs, and real life expectancy tables don't move like that in twelve-month windows. A number that can drop 13.7% and then rebound 15.9% within two years isn't describing a change in what retirement costs — it's describing a change in how anxious people felt when the survey was in the field.
How Does It Compare to the 4% Rule and Other Calculated Targets?
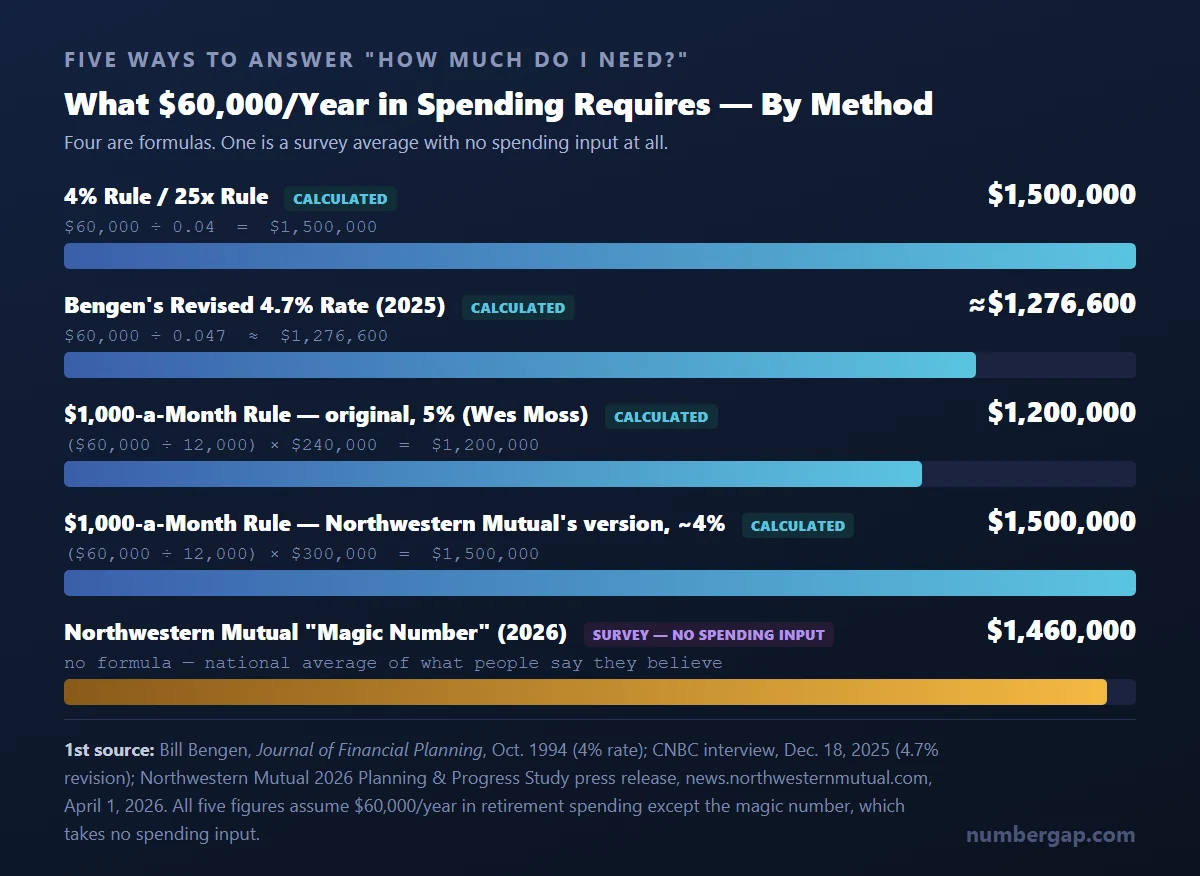
Unlike the magic number, a handful of well-known retirement rules are the output of an actual formula applied to an actual spending amount — not a survey average. Here's what they say for someone who wants $60,000 a year in retirement income, a common assumption used to make them comparable.
| Benchmark | How it's calculated | Result at $60,000/year | What kind of number is it |
|---|---|---|---|
| 4% Rule / 25x Rule | Spending ÷ 0.04 | $1,500,000 | Calculated — Bengen's 1994 historical backtest |
| Bengen's revised 4.7% rate (2025) | Spending ÷ 0.047 | ≈$1,276,600 | Calculated — updated backtest by the same researcher |
| $1,000-a-Month Rule (original, Wes Moss, 5%) | (Spending ÷ 12,000) × $240,000 | $1,200,000 | Calculated — assumes a 5% withdrawal rate |
| $1,000-a-Month Rule (Northwestern Mutual's version, ~4%) | (Spending ÷ 12,000) × $300,000 | $1,500,000 | Calculated — assumes roughly a 4% withdrawal rate |
| Northwestern Mutual "Magic Number" (2026) | Survey average — no spending input at all | $1,460,000 flat | Survey response — not a calculation |
The 4% Rule traces to financial adviser Bill Bengen, who published his research in the Journal of Financial Planning in October 1994. He modeled a 50/50 stock-and-Treasury-bond portfolio against historical U.S. market returns going back to 1926, testing every 30-year retirement window he could find, and identified a 4% initial withdrawal rate that never ran out of money in any of them — a figure he called "SAFEMAX." The Trinity Study, published in 1998 by three Trinity University professors, later reached similar conclusions using a broader range of withdrawal rates and time horizons.
Source: Financial Planning Association, "Revisiting William Bengen's 'SAFEMAX' Portfolio Withdrawal Rate," November 2023; thepoorswiss.com Trinity Study summary, accessed 2026
Even Bengen has revised his own number. In interviews in late 2025, he said updated research — incorporating a broader mix of asset classes — now supports a 4.7% withdrawal rate for a 30-year retirement, and that retirees sticking rigidly to the original 4% figure "may be cheating themselves."
Source: CNBC, "Early retirees may be 'cheating themselves,' says 4% rule creator," cnbc.com, December 18, 2025
Notice the pattern. The top four rows in the table above are all outputs of a formula applied to a specific spending number — change the spending assumption and the target changes with it. The bottom row is a single national average of what people say they believe, and it doesn't adjust for the respondent's actual spending, location, or lifestyle at all. That's the structural reason the magic number can move by hundreds of thousands of dollars in a single year, while the math-based rules only move when the underlying withdrawal-rate assumption itself gets revised — something that took Bengen roughly three decades to do once.
(One separate benchmark worth knowing but not directly comparable here: Fidelity's age-based milestones — 1x salary saved by 30, 3x by 40, 6x by 50, 8x by 60, 10x by 67 — are anchored to income, not spending, so they can't be dropped into the $60,000-spending table above without an extra assumption about salary.)
How Much Have Americans Actually Saved for Retirement?
Far less than $1.46 million, and the honest answer depends heavily on whether you're looking at the median or the average — two numbers that tell very different stories.
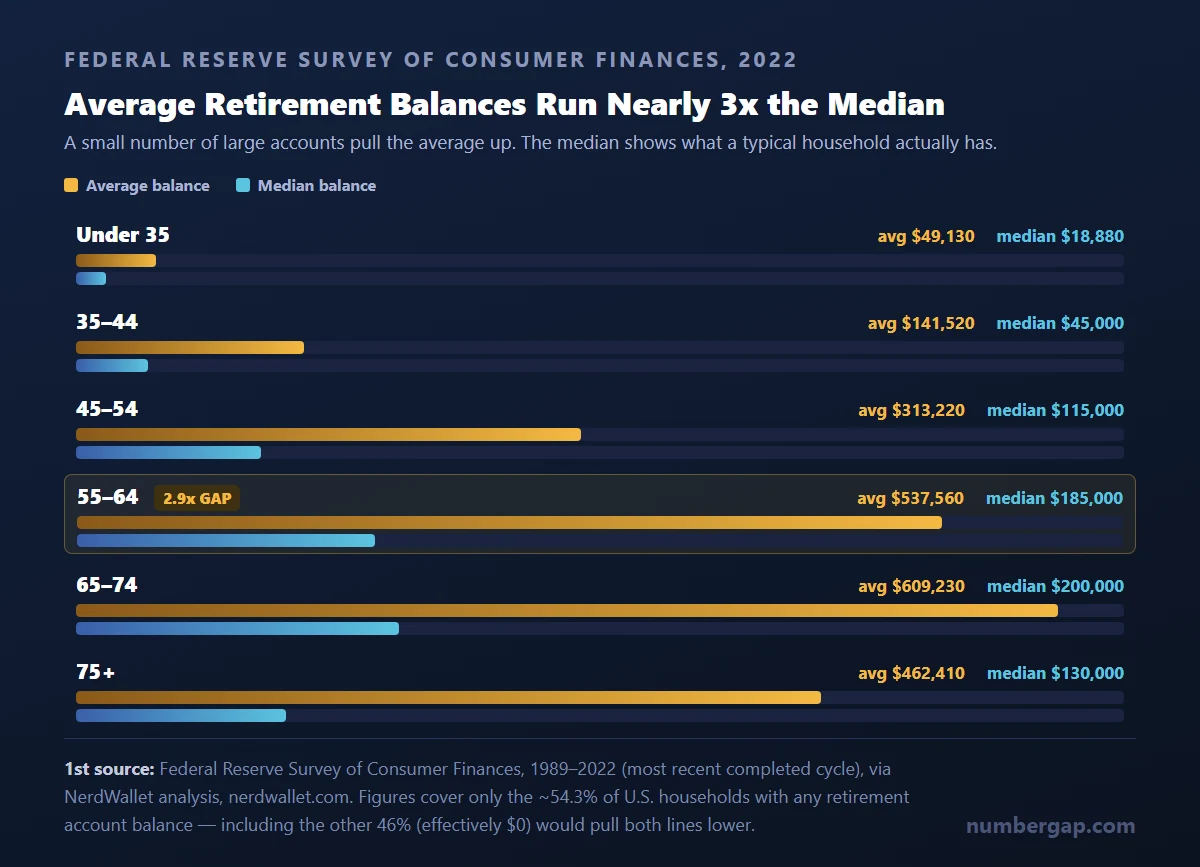
The Federal Reserve's Survey of Consumer Finances (SCF) — a triennial survey of actual household finances, not a "how much do you believe you need" question — is the most rigorous source available. Its most recently completed cycle is from 2022.
| Age group | Average balance | Median balance |
|---|---|---|
| Under 35 | $49,130 | $18,880 |
| 35–44 | $141,520 | $45,000 |
| 45–54 | $313,220 | $115,000 |
| 55–64 | $537,560 | $185,000 |
| 65–74 | $609,230 | $200,000 |
| 75+ | $462,410 | $130,000 |
| All families with retirement accounts | $333,940 | $87,000 |
Source: Federal Reserve Survey of Consumer Finances, 1989–2022, via NerdWallet's analysis, nerdwallet.com, accessed 2026
Two caveats matter here. First, these figures only cover the roughly 54.3% of U.S. households that hold any money in a retirement account at all — include the other 46% (effectively $0 saved), and both numbers drop further. Second, look at the 55–64 bracket — the group closest to retirement. The average balance ($537,560) is nearly three times the median ($185,000). A relatively small number of households with very large account balances pull the average sharply upward, while the median reflects what a typical household approaching retirement actually has. Any comparison to the $1.46 million belief figure should specify which one it's using — the average makes the gap look far smaller than the median does.
The $1.46 Million vs. $88,400 Comparison You'll See Everywhere — and Why It's Wrong
This is the single most common error in coverage of this topic, and it's worth its own section.
Multiple outlets frame the story the same way: Americans believe they need $1.46 million, but the "typical" retirement account holds roughly $88,400 — a gap of about $1.37 million. It's a striking number. It's also comparing two different years as if they were the same one.
The $88,400 figure is Northwestern Mutual's own self-reported average amount Americans said they currently had saved — but it comes from the 2024 Planning & Progress Study, not 2026. It was already down slightly from $89,300 in 2023, and more than $10,000 below a five-year peak of $98,800 in 2021. Northwestern Mutual's 2026 press release does not restate an updated version of this figure at all; instead, it frames current savings adequacy differently, noting that 23% of people with retirement savings have just one year or less of their current income set aside, and only 9% have saved ten times their income.
Source: Northwestern Mutual 2024 and 2026 Planning & Progress Study press releases, prnewswire.com and news.northwesternmutual.com
So when you see "$1.46 million vs. $88,400" side by side, you're looking at a 2026 belief figure next to a 2024 savings figure — three survey cycles apart, during which the "magic number" itself moved by $200,000 twice. A cleaner (though still imperfect) same-purpose comparison: the 2026 belief figure of $1.46 million against the Federal Reserve's most recent median balance for near-retirees ages 55–64, $185,000 from the 2022 SCF. The gap is actually larger this way — about $1.28 million — but at least both numbers describe the same kind of population slice, even if the survey years still don't line up perfectly.
Why "believed need" and "actual savings" shouldn't be read as two answers to the same question in the first place: they're structurally different kinds of numbers. The magic number answers a hypothetical, forward-looking, subjective question — "how much do you think you'll need?" — with no way to verify the answer. The SCF balance is a factual, backward-looking, verifiable account balance reported directly to Federal Reserve interviewers. They also come from different-sized populations (all U.S. adults 18+ vs. households broken out by age) and different sponsors: Northwestern Mutual is an insurance and financial services company with a commercial interest in a "you need $1.46 million and you don't have it" headline, while the Federal Reserve has none. That doesn't make the $1.46 million figure false — it just means the two numbers were never designed to be subtracted from each other.
Source: NerdWallet analysis of Federal Reserve SCF data; editorial synthesis grounded in Northwestern Mutual's own stated business model, northwesternmutual.com
Does Everyone Even Agree on One "Magic Number"?
No — and that disagreement is itself evidence the number is a survey artifact, not a consensus calculation.
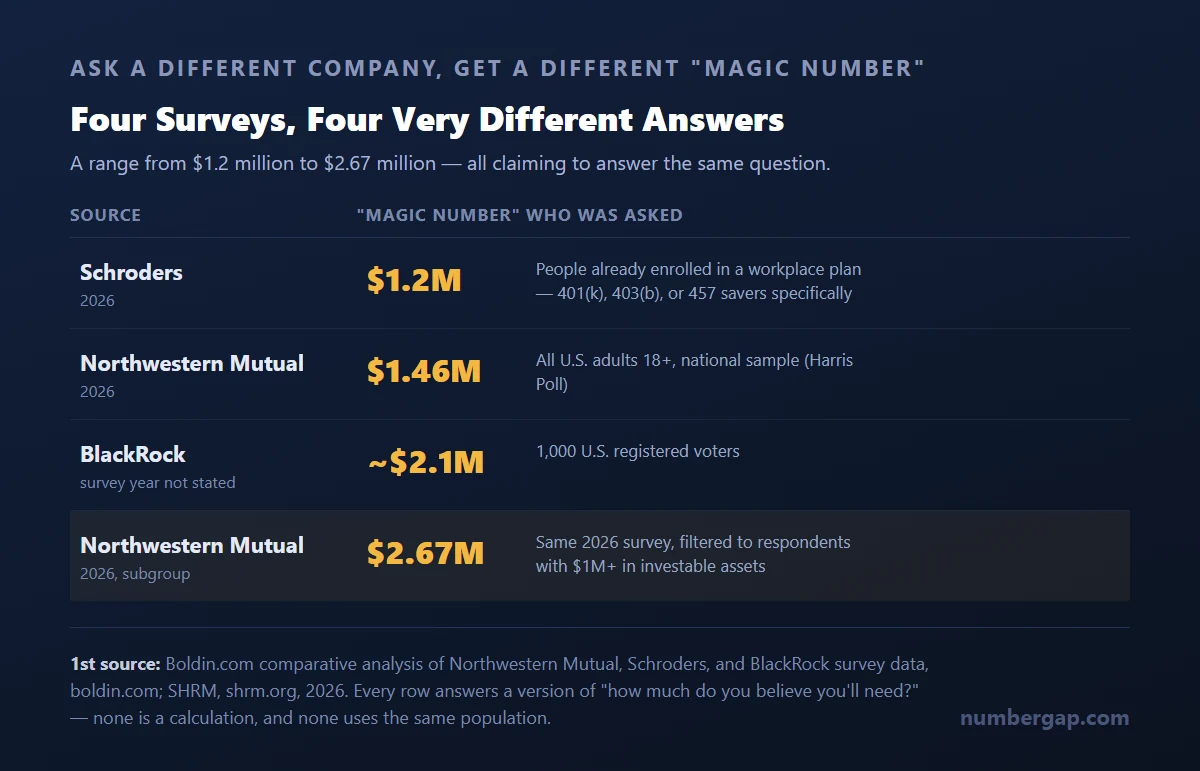
- Schroders (2026) surveyed people already enrolled in workplace retirement plans (401(k), 403(b), 457 savers specifically) and got a "magic number" of $1.2 million — about $260,000 lower than Northwestern Mutual's figure for the same year. Different population, different answer.
- BlackRock, surveying 1,000 registered voters (survey year not specified in the source found), got roughly $2.1 million.
- Within Northwestern Mutual's own 2026 data, people with $1 million or more in investable assets gave an even higher number: $2.67 million.
Source: Boldin.com comparative analysis of Northwestern Mutual, Schroders, and BlackRock survey data, boldin.com, accessed 2026; SHRM, shrm.org, 2026
The number also splits sharply by generation, and the split contains a small irony. This breakdown comes from Northwestern Mutual's 2024 study, pairing each generation's believed "magic number" against what that same generation says it has actually saved.
| Generation | Believed "magic number" (2024) | Actually saved (2024, self-reported) |
|---|---|---|
| Gen Z | $1.63 million | $22,800 |
| Millennials | $1.65 million | $62,600 |
| Gen X | $1.56 million | $108,600 |
| Boomers+ | $990,000 | $120,300 |
Source: Northwestern Mutual 2024 Planning & Progress Study, as compiled by Boldin.com, boldin.com, accessed 2026
The generations furthest from retirement report the highest target numbers and have saved the least toward them. Boomers — the generation closest to actually retiring — report the lowest target of any group. That's not necessarily irrational (older respondents may simply have more realistic information about what retirement actually costs), but it underlines the same point from a different angle: this is a snapshot of how differently people feel about a distant, uncertain future, not a stable financial fact about what retirement requires.
Frequently Asked Questions
Q. Is the retirement "magic number" based on a real calculation?
A. No. Northwestern Mutual's own chief strategy officer told CBS News there's "no major calculation" behind the $1.46 million figure — it's the average of what survey respondents say they believe they'll need, collected by The Harris Poll. Company executives have described it as a "guidepost," not a savings target.
Q. How much money do Americans actually have saved for retirement?
A. It depends heavily on age and whether you look at the median or average. For households ages 55–64 (closest to retirement), the Federal Reserve's 2022 Survey of Consumer Finances found a median retirement account balance of $185,000 and an average of $537,560 — nearly three times higher, pulled up by a smaller number of large accounts.
Q. What is the 4% rule for retirement?
A. It's a formula, not a survey: divide your desired annual retirement spending by 0.04 (or multiply by 25) to get a savings target. It comes from Bill Bengen's 1994 backtest of historical U.S. market returns, later reinforced by the 1998 Trinity Study. Bengen himself has since said an updated 4.7% withdrawal rate may be more accurate for some retirees.
Q. Why did the retirement magic number drop in 2025?
A. Northwestern Mutual's own explanation is cooling inflation — it fell from around 6% in 2023 to roughly 3% in 2024, which coincided with the number dropping from $1.46 million to $1.26 million in the 2025 survey. It then rose back to $1.46 million in 2026.
Q. Is $88,400 how much people have saved for retirement in 2026?
A. No — that figure is from Northwestern Mutual's 2024 study, not 2026, and the company hasn't published a directly comparable updated figure since. Pairing it with the 2026 "$1.46 million" number, as many headlines do, mixes two different survey years.
So What Should You Actually Aim For?
Not $1.46 million — at least not automatically. Start with your own expected annual spending in retirement, not a national survey average that doesn't know your ZIP code, your mortgage status, or your health.
Run your own number through the 4% Rule (spending ÷ 0.04) as a starting point, since it's at least a documented, backtested calculation rather than a feeling. Then check where you stand against the Federal Reserve's median balance for your age bracket — a more grounded reality check than either the magic number or its own average.
This article explains where these numbers come from and how they're built; it isn't personalized financial advice. A fee-only financial planner can help you turn your own spending plan into an actual target — which is a different exercise than remembering a number a survey produced in January.


Comments
Post a Comment