What Percentile Is My Salary? The Average Is Misleading
The Social Security Administration says the average U.S. wage in 2023 was $63,932.64.
It also says something most people never see: roughly two out of three wage earners made less than that.
Last updated: 4 September 2026 · Figures and rules in this post are current as of this date.
That is not a typo, and it is not our claim. It is a sentence the SSA itself put on its own data page, and it is the reason "average salary" headlines are so easy to misread.
Search for "what percentile is my salary" and most of what comes up is a take-home-pay calculator or a generic "average American salary" listicle with a single number and no breakdown by percentile. Full percentile ladders exist, but they are usually built by third-party sites from government microdata, not published directly by the agency in an easy-to-read table — and they rarely explain why SSA, BLS, and Census all report different "average" figures. This article works through the primary sources directly, shows the full percentile ladder, and explains why the numbers don't match.
The dollar figures in this article reflect 2023 data (the most recent year SSA has published) and 2024 data from the Census Bureau's September 2025 income report. Checked current as of September 2026.
Why Does the "Average" Salary Feel Impossibly High?
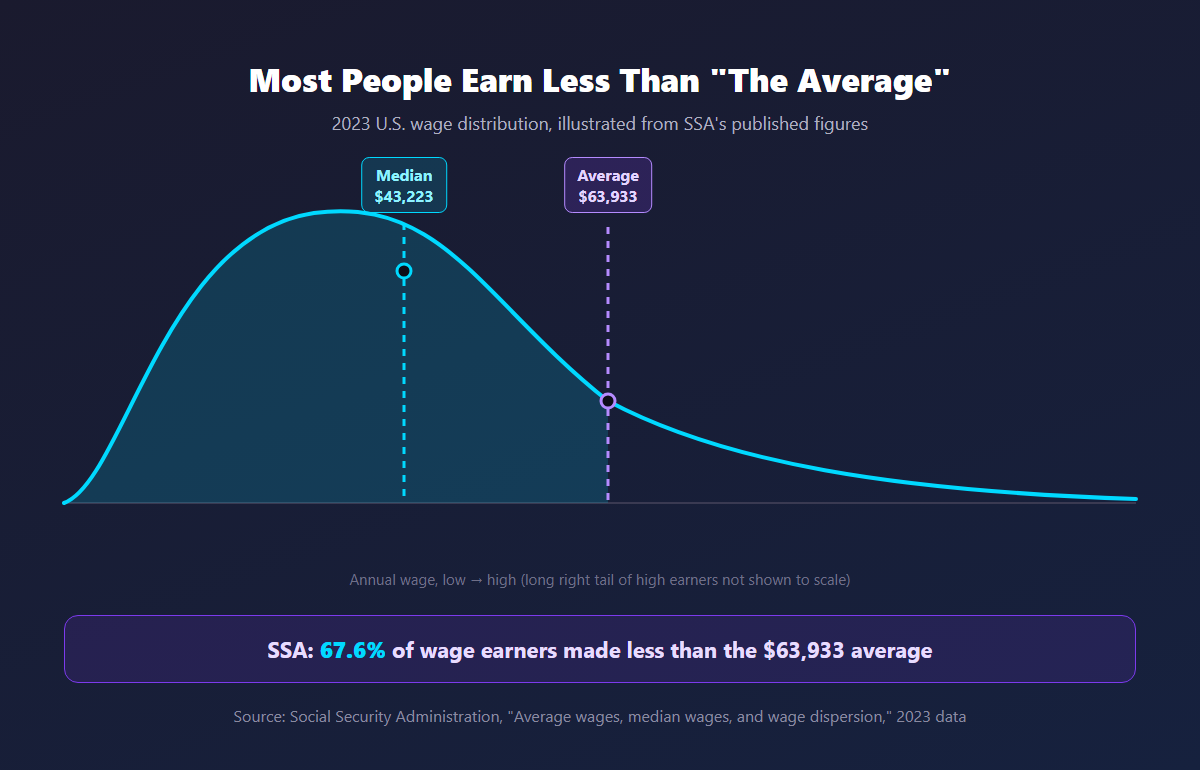
Because the average is pulled upward by a relatively small number of very high earners, while the median — the wage of the person exactly in the middle — sits much lower.
The Social Security Administration counted 173,670,935 wage earners in 2023. The average ("raw") net compensation across all of them was $63,932.64. The median — SSA's own estimate of the wage earned by the person exactly in the middle of that distribution — was $43,222.81, about a third lower than the average.
Source: Social Security Administration, "Average wages, median wages, and wage dispersion" (ssa.gov/oact/cola/central.html), primary data page — read directly by the main agent in a browser after the researcher's automated fetch was blocked.
SSA states this directly, in its own words, on that page: about 67.6 percent of wage earners had net compensation at or below the $63,932.64 average wage. Read that again — most people earn less than "the average." That is the whole reason average-salary headlines feel discouraging: the statistic itself is built to sit above where most people actually are.
What Salary Puts You in the Top 1%, 5%, 10%, or 20%?
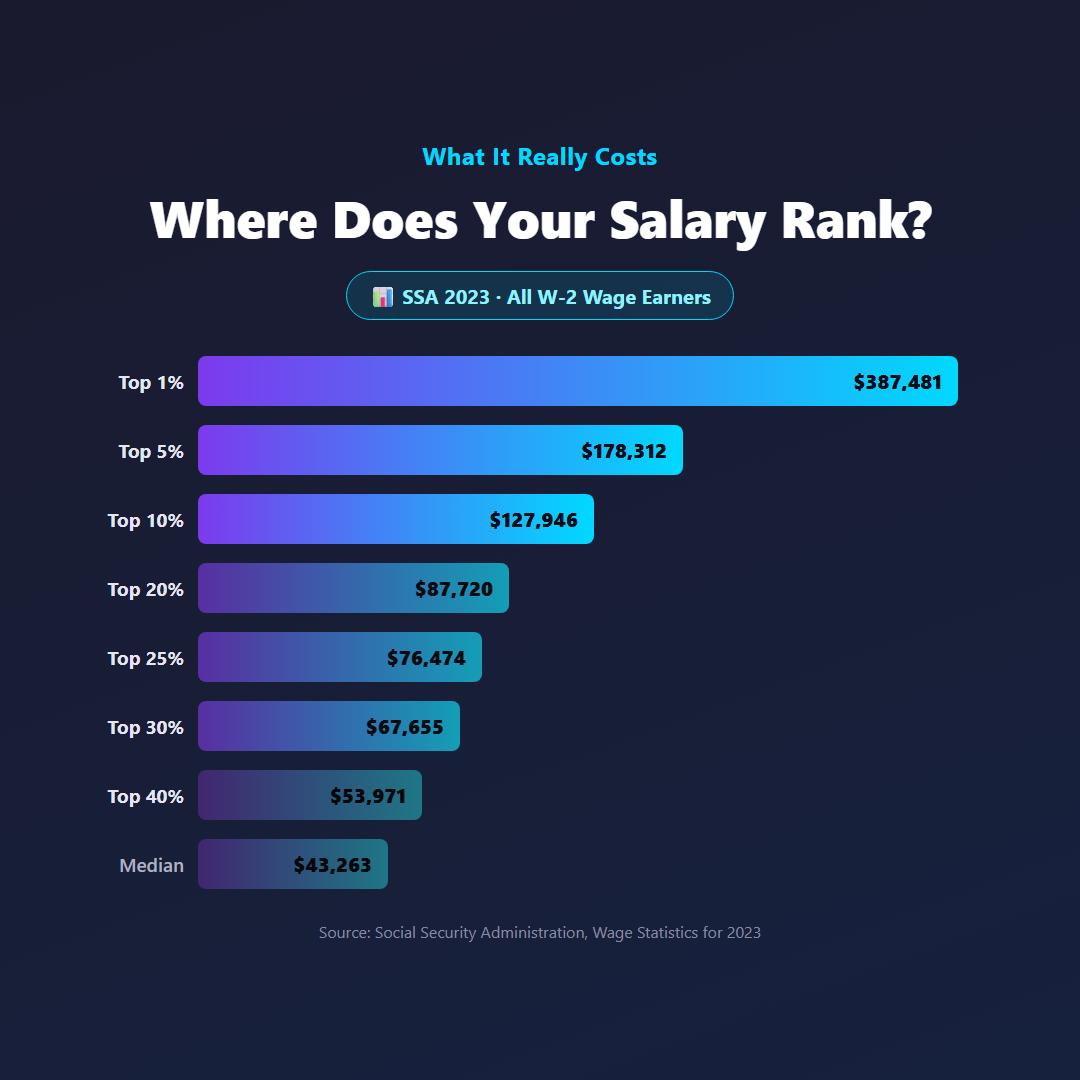
Here is the full 2023 percentile ladder, built directly from SSA's published wage distribution.
| You earn more than… | Annual wage (2023) |
|---|---|
| Top 1% | $387,481 |
| Top 5% | $178,312 |
| Top 10% | $127,946 |
| Top 20% | $87,720 |
| Top 25% | $76,474 |
| Top 30% | $67,655 |
| Top 40% | $53,971 |
| Top 50% (median) | $43,263 |
Source: Social Security Administration, "Wage Statistics for 2023" (ssa.gov/cgi-bin/netcomp.cgi?year=2023), the full frequency distribution of all 173,670,935 wage earners — the most recent year SSA has published. Thresholds computed by the main agent from this table; see the next section for method.
If your salary sits above $127,946, you're earning more than roughly 90% of American wage earners counted by SSA. Above $387,481 puts you in the top 1%. Below $43,263, you're below the midpoint of the distribution — but as the section above shows, so is most of the country relative to the average.
How Were These Percentile Thresholds Calculated?
SSA doesn't publish a ready-made percentile table — it publishes a frequency distribution in $5,000 wage bands, each with a cumulative percentage. The thresholds above were built by linearly interpolating within the band where each percentile falls.
Two checks were run to confirm the method holds up:
- The interpolated median came out to $43,263 — versus SSA's own published median estimate of $43,222.81, a difference of only +0.09%.
- The interpolated share of wage earners at or below the average wage came out to 67.6% — matching SSA's own stated 67.6% exactly.
These are estimates derived from a published table, not percentile figures SSA itself labels and publishes — that distinction matters, so it's stated here plainly rather than glossed over.
One more thing the table reveals: SSA counts everyone with any W-2 wages, including part-time and part-year workers. Nearly 16.8 million people in the 2023 file earned under $5,000 for the whole year. That's not a data error — it's what SSA chose to count — but it's a big part of why the median lands where it does.
How big a part? We can test it against SSA's own table.
Take the same distribution and simply leave out the 16.8 million people who earned under $5,000 for the year. The median rises from $43,263 to $48,218. Leave out everyone who earned under $15,000 — roughly 36.9 million people, most of whom did not work a full year — and the median rises to $54,684.
Recomputed by us from SSA's published 2023 distribution table, using the same interpolation described above, with the lowest wage brackets removed from the count.
Nobody in that data got a raise. Not one paycheck changed. The median moved 26% because we changed who was standing in the room.
That is the honest answer to "what percentile is my salary." Your percentile is not a property of your salary alone. Half of it is decided by who you are being measured against — and every agency draws that circle differently. Before you compare yourself to a number, find out who that number counted.
Why Do SSA, BLS, and Census All Report Different "Average" Salaries?
Because each one counts a different population, using a different method, and sometimes a different definition of income.
| Source | 2023–2024 "average" figure | What it actually measures |
|---|---|---|
| SSA (net compensation) | $63,932.64 | Every W-2 wage earner, including part-time and part-year workers |
| BLS OEWS | $67,920 (May 2024) | Wage-and-salary employees at surveyed establishments only; excludes the self-employed |
| Census/DQYDJ (individual income) | $73,471.51 | All individual income types — wages plus self-employment, investment, and other income |
Source (SSA): ssa.gov/oact/cola/central.html, read directly by the main agent.
Source (BLS): "Overview of May 2024 occupational employment and wages," bls.gov/oes/2024/may/overview_2024.htm — official government source.
Source (Census-derived): DQYDJ, "Average, Median, Top 1%, and all United States Individual Income Percentiles in 2024," based on Census ASEC microdata released September 2024 — this is a third-party calculation built from government microdata, not a figure the Census Bureau itself publishes as a single headline number.
BLS's OEWS program surveys about 200,000 business establishments and only counts wage-and-salary jobs — the self-employed and business owners aren't in it. SSA counts every W-2 wage earner regardless of hours worked. Census's individual-income figure counts a different thing entirely: all income, not just wages, including self-employment and investment income. None of the three is wrong. They're built to answer different questions, and roughly $10,000 of the gap between them comes entirely from that.
Household Income vs. Individual Earnings — Which One Is Your Number?
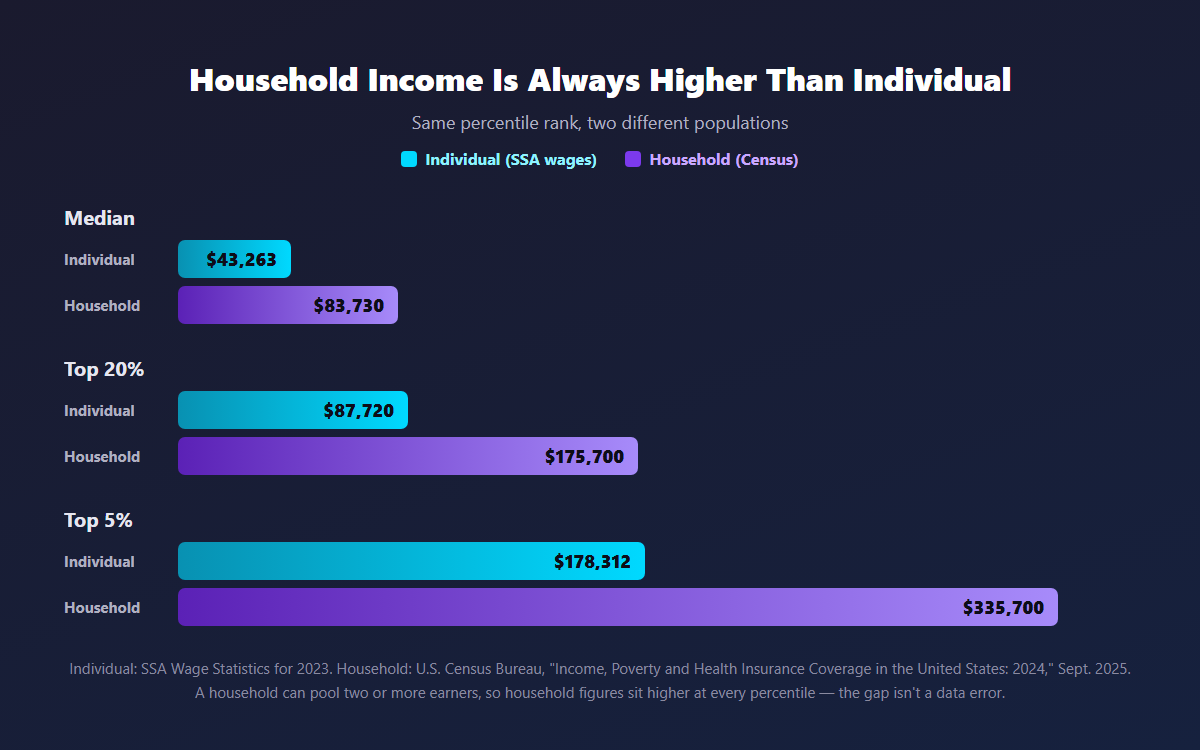
If you've seen a headline like "median household income is $83,730," it is not describing the same thing as "median individual earnings of $43,223" or "$50,200" — and the two shouldn't be compared directly.
- Real median household income, 2024: $83,730 (not statistically different from 2023's $82,690).
- Top 20% of households begins above $175,700.
- Top 5% of households: $335,700 or higher.
Source: U.S. Census Bureau, "Income, Poverty and Health Insurance Coverage in the United States: 2024," press release, September 2025 — official government press release.
A household can contain two or more earners — think two working spouses — so household figures are mechanically higher at every percentile than individual figures. That gap isn't a measurement error; it reflects pooled income. This research did not locate a clean, official "top 10% of households" dollar figure — Census publishes the quintile ($175,700) and top-5% ($335,700) thresholds, but not a standalone top-10% number in the tables reviewed here, so this article isn't going to guess at one.
The takeaway: any claim shaped like "the top 10% of Americans earn $X" needs to specify household or individual — because conflating the two is one of the most common errors in casual reporting on income.
Is This Gross Salary or Take-Home Pay?
Every figure in this article — SSA, BLS, Census — is pre-tax, gross income. None of them report take-home pay.
When someone searches "what percentile is my salary," they're usually comparing a number from a pay stub or offer letter against these percentile tables — but the tables were never built to match net pay. Two people with the identical $80,000 gross salary can take home noticeably different amounts depending on state taxes, retirement contributions, and health insurance deductions. That mismatch doesn't make the percentile tables wrong; it just means gross and net answer different questions, the same way SSA and BLS answer different questions about "average."
Frequently Asked Questions
Q. What salary is considered top 10% in the US?
A. By SSA's 2023 wage data, the top 10% threshold is $127,946 (individual wages). By Census-derived individual income data (all income types), the comparable figure sits closer to $150,000. The two differ because SSA counts wages only; Census-derived figures count all income sources.
Q. What is the average American salary?
A. It depends which government source you use: SSA says $63,932.64 (net compensation, 2023); BLS OEWS says $67,920 (wage-and-salary employees, May 2024); Census-derived individual income data says $73,471.51 (all income types, 2023 earnings). All three are legitimate — they just count different populations.
Q. Why is the median salary so much lower than the average?
A. Because a relatively small number of very high earners pull the average up, while the median — the earner exactly in the middle — doesn't move much. SSA itself states that about 67.6% of wage earners made less than the average wage in 2023.
Q. Household income vs. individual income — what's the difference?
A. Household income adds up everyone living in the same home; individual income is one person's earnings alone. Median household income ($83,730) is not comparable to median individual earnings ($43,223–$50,200) because households often pool two or more incomes.
Q. Are these percentile figures based on gross pay or take-home pay?
A. Gross, pre-tax pay. SSA, BLS, and Census all report income before taxes. None of the primary sources used here report net/take-home pay.
How to Find Your Own Percentile
Start with the population that matches your situation. If you're a W-2 wage earner, SSA's table above is the most direct primary source — it counts essentially every wage earner in the country, not a survey sample. If you're comparing household finances, use the Census household figures instead of the individual ones, and don't mix the two.
The habit that clears up most of the confusion around this topic is simple: whenever you see a salary percentile claim, ask what got counted — every wage earner or only full-time ones, wages only or all income, gross or take-home, individual or household. Answer those four questions and most "conflicting" statistics turn out not to conflict at all.
This article isn't financial advice — it's a check on where a commonly cited number actually comes from.


Comments
Post a Comment