How Much House Can I Afford With a $100K Salary?
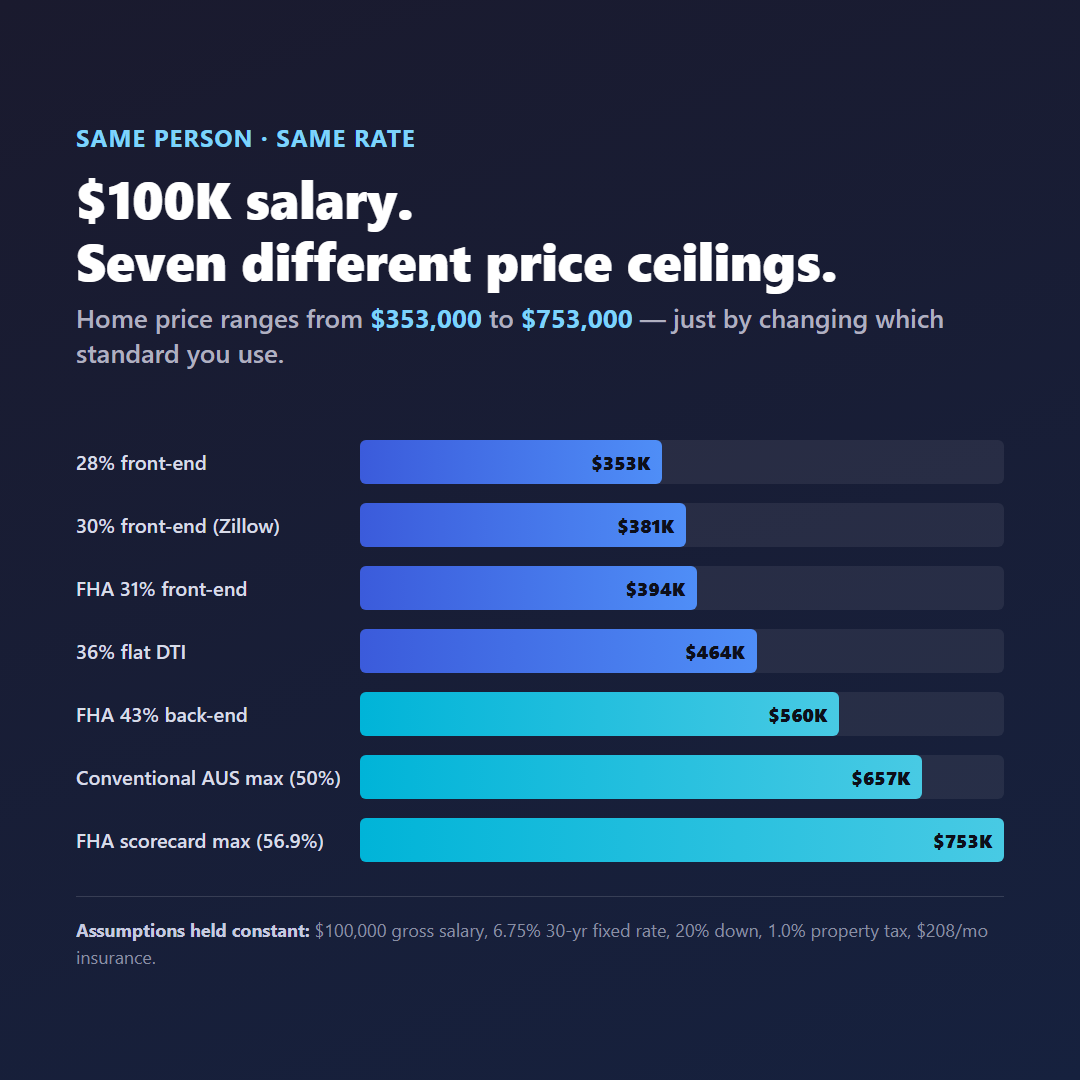
Type the same $100,000 salary into five different mortgage calculators and you will get five different answers.
Last updated: 4 September 2026 · Figures and rules in this post are current as of this date.
Not close answers. Answers that are more than $100,000 apart, sometimes more than double.
That is not a glitch in any one calculator. It is because "how much house can I afford" is not one question — it is at least five different questions wearing the same headline, and each calculator has quietly picked one without telling you which. This piece runs the same salary, the same rate, and the same tax and insurance numbers through each of the real rulesets lenders actually use, so you can see exactly where the gap comes from.
Why Every Mortgage Calculator Gives You a Different Number
Every affordability calculator draws a line somewhere between "your income" and "the maximum housing payment a lender will approve." The problem is that there is no single agreed-upon line — there are at least six, and calculators rarely say which one they picked.
Bankrate, which explains the classic 28/36 split (28% of income on housing alone, 36% on housing plus all other debt), is upfront that this is "not a law, just a guideline." Different loan programs apply different ratios entirely — a conventional loan, an FHA loan, a VA loan, and a USDA loan can each have their own ceiling for the same borrower.
Source: Bankrate, "What Is The 28/36 Rule For Home Affordability?"
https://www.bankrate.com/mortgages/what-is-the-28-36-rule/
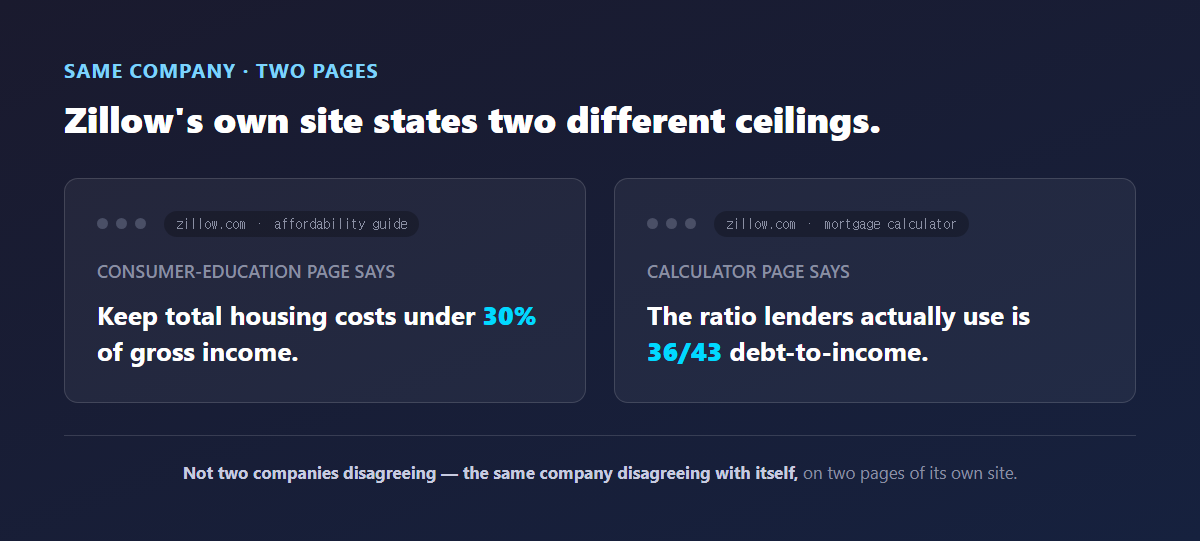
NerdWallet's calculator uses a flat 36% debt-to-income ratio as its ceiling — the back-end half of the 28/36 rule, applied on its own. Zillow's own site states two different numbers on two different pages: its consumer-education content recommends keeping total housing costs under 30% of gross income, while a separate page on Zillow's own affordability calculator tells readers the ratio lenders actually use is "36/43." That is not two competing companies disagreeing — that is the same company disagreeing with itself.
How Much House Can I Afford With a $100K Salary? ($353K to $753K, Same Everything Else)
The honest answer is: it depends entirely on which ceiling you apply, and the gap is not small. Holding the salary, the mortgage rate, the down payment, the property tax rate, and the insurance cost exactly the same, and changing only which published DTI standard is used, the maximum home price for a $100,000 salary ranges from about $353,000 to about $753,000.
Here is the same borrower, run through each standard:
Fixed assumptions: $100,000 gross salary ($8,333/month), no other monthly debt, 30-year fixed mortgage at 6.75%, 20% down payment (to keep PMI out of the comparison), property tax at 1.0% of home value per year, homeowners insurance at $208/month (the 2026 national average).
| Standard applied | Housing budget as % of gross income | Approx. max home price |
|---|---|---|
| 28% front-end (the "28" in 28/36; also Chase's own worked example) | 28% → $2,333/mo | ~$353,000 |
| 30% front-end (Zillow's stated guideline) | 30% → $2,500/mo | ~$381,000 |
| FHA 31% front-end | 31% → $2,583/mo | ~$394,000 |
| 36% flat DTI, no other debt (NerdWallet's ceiling; also Redfin's approach) | 36% → $3,000/mo | ~$464,000 |
| FHA 43% back-end, no other debt | 43% → $3,583/mo | ~$560,000 |
| Conventional, Fannie Mae's automated underwriting max | 50% → $4,167/mo | ~$657,000 |
| FHA's automated scorecard max, with strong compensating factors | 56.9% → $4,742/mo | ~$753,000 |
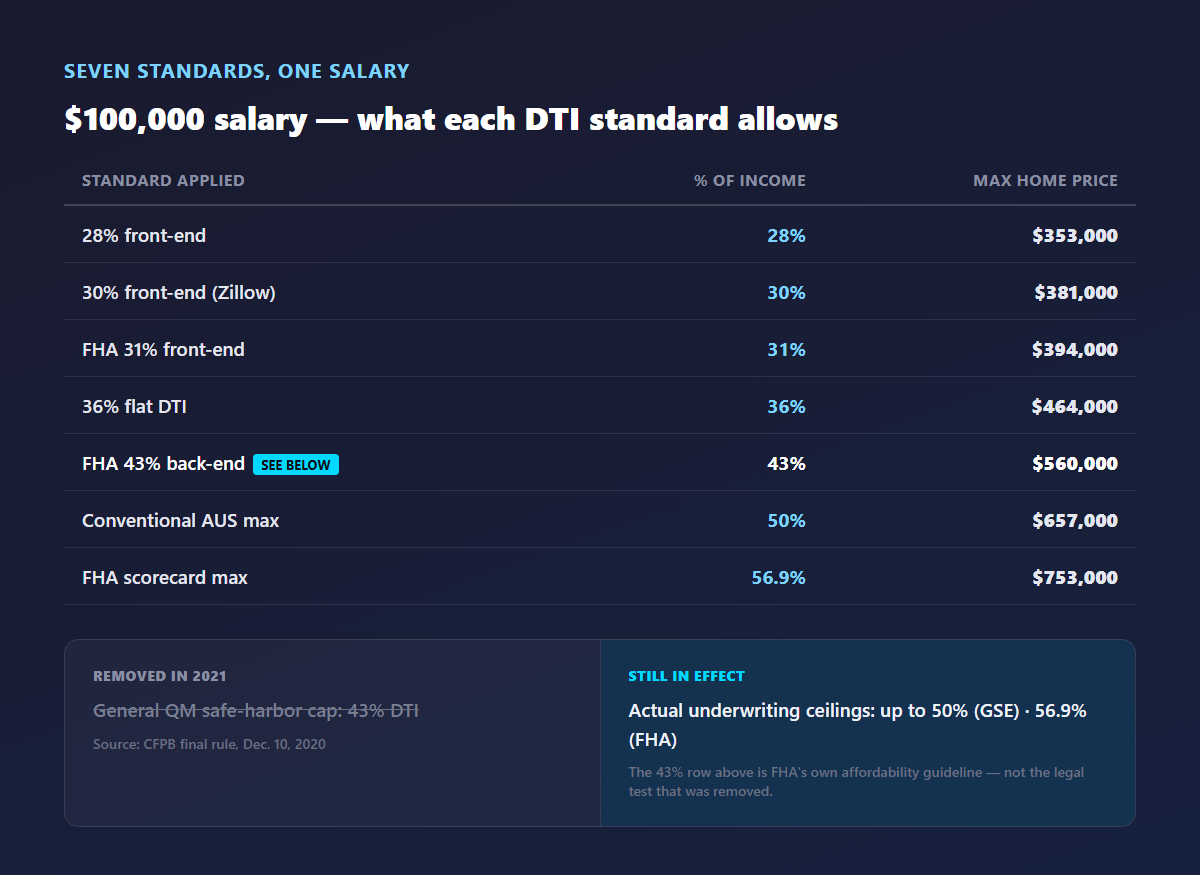
The math above was calculated for this article using the confirmed rate, tax, and insurance figures cited throughout this piece — it is not quoted from any single calculator. Three caveats matter if you are doing this for real: FHA loans typically use 3.5% down, not 20% — the 20%-down assumption here was held constant on purpose, to isolate the effect of the ratio itself. Adding back other monthly debt (a car payment, student loans, credit cards) pulls every row down — roughly $65,000–$70,000 less home price per extra $500/month of debt, based on aggregated affordability-calculator reporting. And a mortgage rate a full point higher or lower moves every number in the table by tens of thousands of dollars, so treat this as a snapshot, not a promise.
What the real, published calculators say for $100K
Three calculators publish an actual dollar figure for a $100,000-salary borrower, and they land in a much narrower band than the table above:
| Calculator | Method used | $100K-salary result |
|---|---|---|
| Chase | 28% front-end, 20% down, 6.5% rate, Dallas-area taxes/insurance | $425,000 home, $340,000 loan, ~$2,575/mo PITI |
| Redfin | 36% flat DTI, 20% down, zero other debt | "$425,000 and below" |
| Lower Mortgage | 36% DTI, 10% down (which triggers PMI), 6.5% rate | ~$327,626 |
NerdWallet, Zillow, and Bankrate publish the ratio they use (36%, 30%/36-43%, and 28/36, respectively) but this research did not find a specific $100,000-salary dollar figure published on their sites. Among the calculators that do publish one, the real-world spread for the same $100,000 salary is roughly $327,626 to $425,000 — worth noticing, because it is much tighter than the $353,000–$753,000 spread you get from simply picking a different regulatory ceiling by hand. Most calculators are quietly conservative; the full spread only shows up once you compare against what a lender's automated underwriting system will actually approve.
Is the 43% DTI Rule Still in Effect? No — Here's What Replaced It in 2021
If you have read that lenders cap debt-to-income at 43%, that used to be true, and it has not been true since 2021 — but the correction is easy to overstate, so it is worth being precise.
Until 2021, a loan qualified for "General QM" status — a legal safe harbor for the lender, not a hard rule for all borrowers — only if the borrower's total DTI stayed at or under 43%. The CFPB's own final rule changed that:
"the final rule removes the General QM loan definition's 43 percent DTI limit and replaces it with price-based thresholds"
Source: Consumer Financial Protection Bureau, "Qualified Mortgage Definition Under the Truth in Lending Act (Regulation Z): General QM Loan Definition," final rule issued Dec. 10, 2020
https://www.consumerfinance.gov/rules-policy/final-rules/qualified-mortgage-definition-under-truth-lending-act-regulation-z-general-qm-loan-definition/
In place of a DTI number, the rule now checks how far a loan's APR sits above the Average Prime Offer Rate for a comparable loan — a "price-based" test instead of an income-math test. It took effect Feb. 27, 2021, with mandatory compliance from July 1, 2021. For 2026, a first-lien loan is priced out of General QM safe-harbor status if its APR exceeds APOR by more than 2.25 points on loans of $137,958 or more, 3.5 points on loans between $82,775 and $137,958, or 6.5 points on loans under $82,775.
Source: CFPB, Truth in Lending (Regulation Z) annual threshold adjustments, 2026 figures
https://files.consumerfinance.gov/f/documents/cfpb_combined-reg-z-thresholds-adjustment-rule_2024-11.pdf
What this does not mean: it does not mean lenders stopped looking at DTI. The 43% figure that got removed was a specific legal test — the General QM safe harbor — not the ceiling an underwriter actually applies when deciding whether to approve your loan. Those underwriting ceilings are separate, still very much alive, and higher: Fannie Mae's automated underwriting system allows up to 50% DTI, and FHA's automated scorecard can go as high as 56.9% for well-qualified borrowers. A lender can absolutely still turn you down over your DTI — the number that changed in 2021 governed the lender's own legal liability, not whether you get approved.
The 43% number that still circulates in a lot of mortgage content online is describing a rule that has not existed for five years. It was replaced, not removed — the replacement just isn't a DTI percentage anymore.
Front-End vs. Back-End DTI (and Why FHA's 31/43 Isn't a Hard Ceiling Either)
Front-end DTI counts only your housing costs — principal, interest, property tax, homeowners insurance, mortgage insurance, and HOA dues where they apply — divided by your gross monthly income. Back-end DTI adds every other recurring debt on top: car payments, student loans, credit cards, personal loans, alimony, child support.
Source: FREEandClear, "Front End and Back End Mortgage Debt-to-Income Ratios"
https://www.freeandclear.com/community/what-are-the-front-end-and-back-end-debt-to-income-ratios-for-a-mortgage
HOA dues are a good example of why calculators disagree even within the same household: they typically count toward the front-end housing-cost ratio, but not toward DTI math the same way a car loan does — so whether a given calculator even asks about your HOA fee changes your result if you're buying a condo.
FHA's published guideline is 31% front-end / 43% back-end — but like the old CFPB rule, this is described as a starting point that HUD explicitly allows lenders to exceed with documented compensating factors:
- 31/43 — no compensating factors
- 37/47 — one compensating factor
- 40/50 — two or more compensating factors
- Up to 46.9% front-end / 56.9% back-end — loans run through FHA's automated TOTAL Mortgage Scorecard, for borrowers with a credit score of 620 or higher and strong compensating factors
Common compensating factors include a credit score above roughly 720, six or more months of mortgage-payment reserves in savings, a loan-to-value ratio under 75%, and a new housing payment that is close to what you are already paying in rent.
On the conventional side, Fannie Mae's own Selling Guide — checked directly for this research — states that its automated underwriting system (Desktop Underwriter) allows DTI up to 50%, while manually underwritten loans are capped at 36%, extendable to 45% for borrowers who meet credit-score and reserve requirements.
Source: Fannie Mae Selling Guide, B3-6-02, "Debt-to-Income Ratios"
https://selling-guide.fanniemae.com/sel/b3-6-02/debt-income-ratios
Freddie Mac is reported by multiple secondary sources to work similarly through its own automated system (up to 50% in certain risk classes), but this research could not directly confirm that figure against Freddie Mac's own guide — treat it as lower-confidence than the Fannie Mae number above.
Where Did the 28/36 Rule Actually Come From? We Couldn't Find a Primary Source
This is the number nearly every calculator cites as "the" rule of thumb, so it deserves an honest answer to "where did it come from" — and the honest answer is that we couldn't fully trace it, and neither, apparently, could anyone else.
Wikipedia's entry on debt-to-income ratio states that in the 1970s, underwriting only capped the front-end (housing-only) ratio at 25%, with no codified back-end limit — because "not until the 1970s that the average working person carried credit card balances" in meaningful amounts. It says the back-end limit was added gradually in later decades as credit scoring evolved and lenders learned empirically how much risk was profitable. But that article does not cite a specific year, institution, or document for when the numbers became exactly "28" and "36."
Industry explainer sites broadly repeat a version of the same story — that the rule "dates to the 1970s when lenders and the government-sponsored enterprises established it based on historical default data" — without linking to a primary underwriting manual that actually printed those two numbers. A personal-finance site, I Will Teach You To Be Rich, states it more plainly: "the exact first appearance [of the 28/36 rule] is unknown."
Source: I Will Teach You To Be Rich, "The 28/36 Rule"
https://www.iwillteachyoutoberich.com/28-36-rule/
So the fair conclusion is not "28/36 has no basis" — it clearly reflects decades of real lender and GSE underwriting experience. The fair conclusion is that a rule nearly every mortgage calculator on the internet cites as gospel has no traceable founding document, at least not one this research could locate. That itself seems worth knowing before you treat "28/36" as a settled fact rather than an inherited habit.
What Calculators Don't Ask You (But Should)
Even with the ratio held constant, calculators disagree because they make different assumptions about everything else in the payment.
Property tax varies enormously by location — the national average runs roughly 0.9%–1.1% of home value per year, but Illinois' effective rate ($17.93 per $1,000 of home value) is nearly six times Hawaii's ($3.08 per $1,000). A calculator that defaults to a national average without asking your state can be meaningfully wrong in either direction.
Source: ConstructionCoverage, "Where Are U.S. Property Taxes Highest?"
https://constructioncoverage.com/research/average-property-tax-by-state-county-city
Homeowners insurance averaged about $2,490/year (~$208/month) nationally as of 2026.
Source: NerdWallet, "How Much Is Homeowners Insurance? Average 2026 Rates"
https://www.nerdwallet.com/insurance/homeowners/learn/average-homeowners-insurance-cost
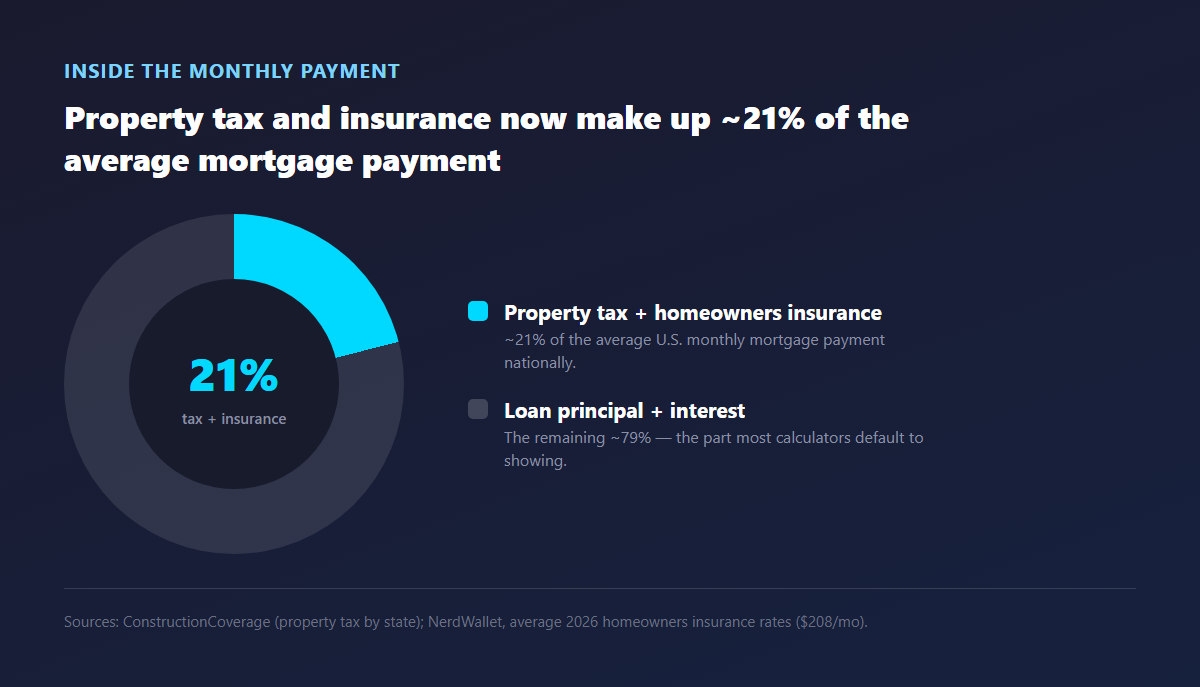
Together, property tax and insurance now make up roughly 21% of the average monthly mortgage payment nationally — large enough that whether a calculator includes them at all changes the affordable price by a real amount, not a rounding error.
PMI (private mortgage insurance, required on conventional loans with under 20% down) runs about 0.46%–1.50% of the loan amount per year depending mainly on credit score and down payment — on a $300,000 loan, that's roughly $115–$375 a month, money that competes with your housing budget the same way a car payment would.
Down payment assumptions are where sources disagree with each other most: reported 2026 first-time-buyer averages range from 8% to 10% depending on the source, the overall national average is cited around 13%, and repeat buyers average roughly 19–23% down. None of these figures cleanly reconcile against each other in this research, which is itself a small example of the article's larger point — even a number as basic as "what does a typical buyer put down" doesn't have one agreed answer.
Mortgage rate context, as a snapshot rather than a fixed fact: in the first days of September 2026, the 30-year fixed rate was being reported in a narrow band — 6.71% (Freddie Mac's survey, Sept. 3, 2026), 6.76% (Bankrate), 6.78% (Mortgage News Daily) — described as the highest level since July 2025. By the time you read this, that number has likely moved; check a current rate before running your own numbers.
Frequently Asked Questions
Q. What is the 28/36 rule?
A. It's a guideline, not a law: keep housing costs at or under 28% of gross monthly income, and total debt (housing plus everything else — car payments, student loans, credit cards) at or under 36%. Different calculators apply only one half of it, or a different pair of numbers entirely, which is a major reason results vary.
Q. Is the 43% DTI rule still in effect?
A. Not as a legal maximum. The CFPB removed the 43% DTI cap from its "General QM" safe-harbor test in a 2020 rule that took effect in 2021, replacing it with a price-based test. Separately, GSE and FHA automated underwriting systems still use their own DTI ceilings (up to 50% and 56.9%, respectively) — those didn't go away, they were never governed by the CFPB rule in the first place.
Q. What debt-to-income ratio do mortgage lenders actually use?
A. It depends on the loan program and how it's underwritten. Manually underwritten conventional loans typically cap around 36% (extendable to 45%), automated conventional underwriting allows up to 50%, and FHA ranges from 31/43 up to 56.9% back-end with strong compensating factors and an automated scorecard approval.
Q. Do HOA fees count toward DTI?
A. They typically count toward your front-end (housing-only) ratio, since they're a recurring housing cost, but they don't factor into DTI math the same uniform way a car loan or credit card does. Whether a specific calculator asks about HOA fees at all affects your result if you're buying a condo or an HOA community.
Q. Does PMI count toward my DTI ratio?
A. Yes — PMI is part of your monthly housing payment (the "I" in the front-end PITI calculation), so it's included in both front-end and back-end DTI math once it applies, typically on conventional loans with under 20% down.
Q. What's the difference between front-end and back-end DTI?
A. Front-end counts housing costs only. Back-end adds every other recurring monthly debt on top of housing. A calculator that quotes "36%" without saying which one it means is quoting an incomplete number.
Q. Affordability vs. pre-approval — what's the difference?
A. They're commonly described as two different questions with two different answers: affordability calculators estimate what's comfortable for your budget, while pre-approval reflects the maximum a specific lender's underwriting will actually let you borrow. The two numbers frequently don't match, and that's expected, not a sign either one is wrong.
So Which Number Should You Actually Trust?
None of the numbers in this article are wrong, exactly — they're each answering a slightly different question. A 28% front-end ceiling is a comfort-based guideline. A 50% DU-approved DTI is what an underwriter will actually let you borrow if you qualify. Both are real; they're just not the same question.
The one number worth remembering from all of this: the 43% DTI figure a lot of mortgage content still repeats as "the rule" describes a legal test that was replaced five years ago. If a calculator or article states 43% as a current hard ceiling without explaining which system it's describing, that's a sign it hasn't been updated since 2021 — worth keeping in mind the next time a calculator hands you a single confident number.
This article summarizes published rules, lender guides, and calculator methodologies as of the dates cited throughout. It isn't personalized lending advice — for your actual numbers, a loan officer or HUD-approved housing counselor can run your specific credit, income, and debt through real underwriting software, which is the only way to get an answer that isn't just one more estimate.


Comments
Post a Comment